Arp objects, QSOs, Statistics

Is the sticking point here the empirical evidence for dark matter, or the mass fraction of said dark matter?

Not to mention the type of dark matter.

If I recall, the Quasi-Steady-State Cosmology model recognizes that there must be some baryonic dark matter existing, everywhere.

Don't QSSC or Plasma Cosmology adherents have a problem with the hugh mass fractions of the will-o-wisp non-baryonic CDM that standard cosmology hangs it's hat on?

I think even TeVeS and MOND predictions are for sizable mass fractions of dark matter in clusters like the Bullet. Just not the large quantities of the non-baryonic stuff.


The sticking point is that BeAChooser does not believe in the existence of dark matter at all. I do not know if he is a QSSC or Plasma Cosmology adherent (the latter looks likely). He calls dark matter a "gnome" added to Big Bang cosmology. When I first brought up the Bullet Cluster and the observation of dark matter there he said it was wrong because of a "host of gnomes".

The first (and only so far) gnome that he came up with is doubts about redshifts as described in this thread (so maybe I am not that far off-topic).
But the Bullet Cluster observation is about the relative masses between the gas in the galactic cluster detected via X-rays and the dark matter detected using gravitation lensing. The distance to the cluster is not an issue.

Since then BeAChooser has been strangely silent on this topic. If he cannot come up with something more then I will have to assume that he now accepts the existence of dark matter and the incorrectness of plasma cosmology.
 
And therein lies part of your problem, David. But I lack the interest to correct your misunderstanding of the problem. :)
How am I not suprised. Whatever. Fare thee well BAC


Don't tell us you work for a pollster? :jaw-dropp
My profile has always refelected my employment.

research in college, research into prevalence and barriers to treatment in mental health and homeless surveys. (Talk about some whinging, man the need to not duplicate surveys really bothers some people.)


In a while crocodile!
 
Help a noob out.............

Trolls are what they are, the most famous on this forum was Jedi Knight, the main strategy of a troll is to just get a response out of you , as in trolling when you are fishing. The are usually not interested in actual discussion but just counting coup in some way. They will ignore any pointed questions and engage in a wide variety of behaviors to avoid answering and making it look as though they are. Trolls mainly just want to spread thier nonsense and that is about it.

Some people look like trools but aren't they are cynics who are just contrarian, like Robinson, whose sarcasm runs deep and wide, he is not a troll, he just is very sarcastic at times.

Take a look at the Patterson-Gimlin thread in the General Sceptcism is you want to see some classic trolling.
 
Psst... this is a thread meant to be about Arp, statistics, please take your darm matter to where it belongs. ;)

Trolling also involves the incessant moving of threads, so that they can be active but avoid questions.
 
Last edited:
Alright already!

Back on topic:

So, are we coming to the following conclusions here:

1) It seems as if a posteriori statistics are used in astronomy perhaps more often than in other technical fields.

2) If we all acknowledge 1), it does seem as if Arp and others who author papers regarding "Arpian" theories are not as rigorous as some of their peers in their application of statistics of any type.

3) With 2) being stated, there are some apparently unique associations between some QSOs and some bright galaxies.

4) The only way to definitively prove that the associations mentioned in 3) are physical, or "Arpian", is to conduct further research, through actual observation or perhaps data mining of sources such as SDSS, etc. This research should be exhaustive in it's sample set selection, and multiple statistical tests should be made.

5) If the work in 4) could be performed, by a knowledgable and dedicated person, there might be a revolution in modern day cosmology in a pot at the end of the rainbow. Or, their might just happen to be a preponderance of universal "gotchas". And Arp is lucky to have found a bunch.

Does anyone agree with some, all or none of these points?

See, I can post on topic!
 
Last edited:
Back on topic:

So, are we coming to the following conclusions here:

1) It seems as if a posteriori statistics are used in astronomy perhaps more often than in other technical fields.

2) If we all acknowledge 1), it does seem as if Arp and others who author papers regarding "Arpian" theories are not as rigorous as some of their peers in their application of statistics of any type.

3) With 2) being stated, there are some apparently unique associations between some QSOs and some bright galaxies.

4) The only way to definitively prove that the associations mentioned in 3) are physical, or "Arpian", is to conduct further research, through actual observation or perhaps data mining of sources such as SDSS, etc. This research should be exhaustive in it's sample set selection, and multiple statistical tests should be made.

5) If the work in 4) could be performed, by a knowledgable and dedicated person, there might be a revolution in modern day cosmology in a pot at the end of the rainbow. Or, their might just happen to be a preponderance of universal "gotchas". And Arp is lucky to have found a bunch.

Does anyone agree with some, all or none of these points?

See, I can post on topic!
.

Now here is an interesting set of questions! :) :cool:

However, if we're talking about astronomy and astrophysics, as branches of science, then 1) starts too far from the beginning to be of much help, and so the rest become not so interesting ...

In any case, 3) does not depend on 1) or 2) ... and unless it is much, much more tightly qualified is so boringly, obviously true that we need not waste any more time on it. Of course, every 'association' between any set of quasars and any set of galaxies (whether bright or not) is unique! What I think you may have intended to say is something about a general pattern, a relationship between a tightly defined subset of quasars and galaxies. This pattern could be something derived from a theory, such as the non-existent one BAC refers to, or simply something empirical, such as was the Hubble relationship in its first decade or so.

That leads to 4): one of the most common methods used in these two sciences (and, no doubt, in many others) is hypothesis formation and testing. It's not a free-for-all; there is centuries of bitter experience behind the 'guidelines' for doing this. In this thread there are, I feel, quite a few examples of misuse of this method (or failure to use it at all, or ...). In any case, your best chance of moving forward, with 4), is to develop a couple of hypotheses and go test them. One could be derived from 'theory', such as the Arp-Narlikar VMH, the other from a careful statement of an empirical relationship.

However, the whole chain (above) can be short-circuited by asking two, very simple, questions:

a) what is a 'quasar'?

b) are 'quasars' a homogeneous class of objects?

At some point, I hope, we will start discussing the former; the latter has already been discussed, and the Arp et al. idea has been shown, rather convincingly, to be inconsistent with thousands of observations.
 
A series of posts on questions that remain unanswered.

In the next few posts I will re-post some questions that I have asked that do not seem to have been answered. It is entirely possible that they were and that I overlooked the answer(s); if so, I'd be grateful if someone could point to the post(s) which contain the answers, and also please accept my apologies in advance for not having found them myself.
----------------------------------------------------------
BAC: And just because Bell used a source that said it wasn't a complete list of all objects doesn't necessarily invalidate the results. Perhaps the objects in that list were a somewhat fair sampling of the overall population of such objects.

DRD: Perhaps they were; perhaps they weren't ... how do you evaluate the extent to which they were?

The context is a Bell paper which concludes that 'quasars' (Bell actually defines these quite clearly) are not at the cosmological distances their redshifts imply (from some form of the Hubble relationship). Central to the logic of Bell's paper is that VCVcat contains a set of 'quasars' that is complete in a well-defined, tightly constrained, sense. However, VCVcat is not such a catalogue. Here is the source post of my unanswered question.
 
Second unanswered question: how does one go about evaluating material such as that in the various Arp et al. papers BAC has cited?

This is a slight paraphrase of the original, which can be found here.
 
This isn't so much an unanswered question as a follow-up one.

How - specifically, quantitatively, within the estimated uncertainties - does an Arpian idea account for the full set of data for the 16 quasars [in a paper cited earlier] (and the existence of ~100 strongly lensed quasars)?

Where is the 'alternative cosmology' account of these results [strongly lensed quasars]?


(source)

Here is BAC's answer: No idea. Maybe Arp, et. al. will try to write one soon.

My follow-on question is: if at least some quasars have been shown, quite convincingly, to be at distances consistent with estimates derived from the Hubble relationship and their redshifts, and if there is no 'alternative cosmology' (or similar) which can account for these results/observations, what is to be gained, in terms of doing science, by a posterori analyses of highly selective quasar-galaxy alignments?

This question can also be asked in a slightly different form, using "well-formulated, quantitative, testable hypotheses" instead of 'alternative cosmology'.

Note that these questions are specific/concrete forms of more general ones about how astronomy and astrophysics, as sciences, are done.
 
Oooo, I have a side bar here in this thread at this post and it is related to the appearance of associations
http://www.internationalskeptics.com/forums/showpost.php?p=3604593&postcount=183

we have a picture of a galaxy and under the picture we have
"What leads you to believe that region is "transparent"? After all, I linked peer reviewed scientific papers by astronomers who conclude it is not. Astronomers who concluded the quasar was almost certainly on this side of NGC 7319 and part of their reasoning was the likely density of obscuring matter. For example, http://www.journals.uchicago.edu/doi...10.1086/426886 states "there are no signs of background objects showing through the disk in our HST picture of the inner regions of NGC 7319"."

Now I am not saying that there are not people who made this statement but that picture contains an 'artifact of exposure' which is ignored in this argument. I would characterize this three ways (by the poster) an appeal to common sense/intuition, a lack of understanding of artifact (which the authors might be guilty of) and what I call 'it looks like a bunny'.

The first and third go together and they are based upon the second, an artifact of exposure.

To gather pictures and discern possible structures long exposure times are used. this has a number of effects it creates a larger burn area around fore ground objects, often obscuring features, it great a look of solidity and opaqueness that may not be there, it brings out the structure of detail objects (but not the objects themselves unless the resolution is high enough), it allows very faint sparse structures to become more apparent.

Here you can see a picture made by the VLT where there is this blurring and hazy effect from the exposure, caused by scattering amongst other things.
http://antwrp.gsfc.nasa.gov/apod/ap011021.html

here is one that due to resolution is even more apparent what blurring by exposure can look like (it is down at the bottom) also look there is a blue ring.
http://images.google.com/imgres?img...brero+galaxy&start=20&ndsp=20&um=1&hl=en&sa=N

and here is one where the effect is compensated for but is still there to some extent
http://antwrp.gsfc.nasa.gov/apod/ap080308.html

Now you will note the prominent bulge is not there in the third picture and that other objects are more visible (although they are foreground objects by and large)

So when the poster makes the statement and provides the statement by the authors what is it doing:

1. Common sense says that in this picture there is a solid area of white something, the poster ignores the artifact and the say ‘it looks like a bunny’, therefore it is a white something that is opaque.

Now I am very curious how the authors came to the conclusion that background objects were not visible , due to this artifact?
 
VCVcat and what's a quasar - appearance and reality?

Perhaps part of what's involved in discussion of VCVcat and its uses is the difference between the surface reality (appearance) and the deeper one.

Briefly, if for Bell's conclusions to hold his selection of objects from VCVcat needed to be an unbiassed sample of some population, then we can say with near certainty that those conclusions do not follow, logically, from his assumptions ... because the objects he selected from VCVcat are certainly not an unbiassed sample (and he did not, it seems, attempt to estimate the bias).

This holds no matter what words of caution the authors of VCVcat wrote in their intro, as one could determine for oneself by looking up the sources the authors used for the objects Bell selected.

Of course, the authors did, in fact, explain how their catalogue was compiled, and they also did warn that it should not be used for statistical analyses ... so the appearance closely matches the reality anyway.

Maybe it's time to look at what a 'quasar' is?
 
While you clearly have put a lot of work into this BeAChooser, I'm sorry to say that it is full of mistakes, of many different kinds.

For those mistakes which are attributable to textbook statistics, may I suggest that an investment of your time in a formal course, or in a good textbook, would be worthwhile?

For the rest of my post, I will focus on the astronomy, and how you have set up your (statistics, arithmetic, etc) problems incorrectly, not on the inner workings of the stats (etc).
Wrong. The paper I cited on NGC 3516 (http://www.journals.uchicago.edu/doi/abs/10.1086/305779 ) talks about 5 quasars along the minor axis. The object at z = 0.089 is identified this way: "there is a very strong X-ray source that is listed as having a Seyfert spectrum (Veron-Cetty & Veron 1996) with redshift z = 0.089 (about 10 times the redshift of NGC 3516). Optically it is a compact, semistellar object. With its strong X-ray and radio properties, it is closely allied to BL Lac objects and therefore to the transition between quasars and objects with increasing components of stellar populations."
.
I already covered this, a bit, in an earlier post; I will address this in much more detail when I discuss "what is a quasar?".

Suffice it to say that how this question is answered is critical to evaluating the kinds of calculation/estimates commonly found in Arpian papers (and in this post of yours I'm quoting).
.
DeiRenDopa said:
Except that two (of six) quasars do not match the predicted z within 0.1
True, but I was trying to simplify the problem by balancing the fact that 3 (of the five) fall into intervals less than 0.10 in width. But since you apparently aren't satisfied with my simplification, let's take another look at the whole problem.

Let's start by matching each observation with it's corresponding Karlsson value: (0.33,0.30) (0.69,0.60) (0.93,0.96) (1.40,1.41) (2.10,1.96). That means the distance from the Karlsson value in each case is 0.03, 0.09, 0.03, 0.01, 0.14 , respectively. To compare with the 0.10 discretization I used in my calculation, we must double those values: 0.06, 0.18, 0.06, 0.02, 0.28 . Note that 3 (of five) fall within a 0.06 discretization but you are correct that 2 don't fall within a 0.10 interval.

Let's redo the calculation for just those three cases and see what we get, assuming again that the quasars randomly came from a population with an equal distribution of probability between 0 and 3.0. There are 50 possible values in that range given an increment of 0.06. Now looking at this again, I don't think I should have used the permutation formula in the previous calculation. This time let's just use the combination formula ... in other words, let's find the number of possible combinations of those those r values from n possible values.

The formula for that is n!/((n-r)!r!). Thus the probability of seeing those 3 values turn up is 1/(n!/((n-r)!r!). In this case, that works out to 1/(50*49*48/3*2) = 5.1 x 10⁻⁵.

And now let's factor in the unlikelihood that we'd find 2 more quasars near that galaxy that are unusually close to the Karlsson (K) values of 0.60, and 1.96. Surely a conservative estimate for that probability would be to simply find the chance of each specific number turning up given an increment appropriate for that case. For the 0.69 case, for example, where the increment is 0.18 (twice the 0.09) value, over the range 0 to 3.0, there are at least 16 increments. So, the probability of finding that number 1/16 = 0.06. For the 1.96 case, the increment needs to be 0.28 and there are 10 possible values. The probability is 1/10 = 0.10. And finding these z's should be relatively independent of finding the others, so the probabilities should simply multiply together to give a final combined probability.

Therefore, I assert that, to a first order, the probability from the 3 number sequence can be adjusted to account for the unlikelihood of the 2 other quasars by multiplying it by 0.06 * 0.1. And that results in a final combined probability of 5.1 x 10-5 * 0.06 * 0.10 = 3.06 x 10⁻⁷. So to a first order, it appears my initial assumption that an increment of 0.1 used for all of them would balance everything out off by a factor of about 10.
(bolding added)

Here are some, just some, of the considerations not included in the above:

* how was NGC 3516 selected? We know, from the Chu et al. paper, that it was most certainly not a random selection!

* how many 'near NGC 3516 quasars' were known before Chu et al. planned their observations? before Arp chose to look at the field around NGC 3516 again? We know, from the Chu et al. paper, that there was at least one ("One of the objects, Q1107]7232 (C\7.1), is already listed in the Hewitt-Burbidge (1993) quasar catalog.")

* how are quasar redshifts distributed, in [0,3]? If they are not distributed equally (to within some bound), then probability calculations need to reflect that non-equal distribution

* your calculation, on its own, would seem to apply to any set of three numbers in [0,3]; you have calculated the a posterori probability, and not addressed sol invictus' comment (in another thread)

.
And lest you think the selection of z = 3.0 as the upper bound in my calculation is arbitrary, let me note that I found a mainstream source that said, based on the SDSS study, the number of quasars decreases by a factor of 40 to 50 from z = 2.5 to z = 6.0. Therefore, I think I am justified in using a range of z = 0 - 3.0 in my calculations for quasar z. I will agree that the density of quasars of different z is not uniform over the range. Several of the sources I found indicated that it climbs rather steeply from a value at z = 0 to z = 1.5 and then levels off through z = 3.0. I don't see an easy way to incorporate this fact into the calculation but I don't think it really makes much of a difference since the differences between the Karlsson values and the observed z don't appear to have much of a trend up or down over the range.
.
As I noted earlier, if the range is [0,3], then all the Karlsson values in that range need to be included.
.
However, since you questioned my 0.10 simplification, I'm going to take another look at the rest of the calculation, starting with what I estimated was the total number of quasars in the sky. Recall that I estimated the total number of quasars that can be seen as 1,237,500 ... by multiplying the number of square degrees in the sky (41,250) by 30 quasars per square degree. But is 30 quasars per square degree really a reasonable value to use?

Here's a 2005 study http://www.iop.org/EJ/abstract/1538-3881/129/5/204 that indicates an average density of 8.25 deg-2 based on the SDSS survey then argues it should be corrected upward to 10.2 deg-2 to make it complete. And if you go to the SDSS website (http://www.sdss.jhu.edu/ ) you find they say the effort will observe 100,000 quasars over a 10,000 deg2 area. That also works out to about 10 quasars deg-2. So it looks like I used a number that was 3 times too large in my earlier calculation. In this revised calculation, I will only assume the average quasar density is 10 deg-2. That means the total number of quasars than can be seen from earth is around 410,000.
.
The Chu et al. paper carefully explains how they chose which objects to observe (in order to measure redshifts); the "average density" of quasars you need to use in this part of your calculation is that which would be obtained if the search method used in Chu et al. were to be used over the whole sky. As there appears to be no effort to explain this, in any quantitative fashion, let alone estimate it, you are left with an unknown.

It might be possible to estimate bounds on this, but without any such attempt, you have no basis for this calculation at all.

Oh, and as I explained in a reply to Wrangler earlier, in any case, you need at least a measure of the variation in average density (as well as the average density), to make the sorts of estimates this part of calculation aims to do.
.
So now we come to the question of how those 410,000 quasars are distributed, or more precisely, how many galaxies with 5 or more quasars near them can be expected in the total population of galaxies that can be seen. Now recall that in my previous calculation I initially assumed that the all the quasars are located near galaxies and distributed 5 per galaxy until the number of quasars available is exhausted. That resulted in an estimate of 250,000 (~ 1,237,500 /5) galaxies with 5 quasars each. Doing that maximized the total number of galaxies assumed to have 5 quasars which was a conservative approach from the standpoint of not wanting to over estimate the improbability of the observation of NGC 3516.

But the truth is that most quasars do not lie close to galaxies at all (certainly not galaxies where we can discern any detail as is the case in all three examples of interest here) so that's why I later multiplied the calculated probability by 0.10 to account for the assumption that only 10% of quasars lie next to a galaxy. I still think that's probably a reasonable number. But for this calculation, I'm going to give your side the benefit of the doubt and assume that fully half of all quasars are near galaxies. That has to be very conservative. Wouldn't you agree. So now there are 205,000 in the population that we need to distribute amongst galaxies.
.
Making up numbers, and using one's intuition about what's conservative, reasonable, etc, in astronomy is an almost certain way to be wrong.

There are many approaches to choose from, when it comes to determining robust bounds/estimates; they all involve much greater use of the hard-won data astronomers have gathered these past century or three than the approach above.

One modern method is a Monte Carlo simulation; one reason it's popular is that it can test models that have a range of input parameters, and they can avoid the need to work through the intermediary steps.
.
It's also apparent that most galaxies that have nearby quasars only have a few quasars ... not 5 or more. I didn't find any source actually quantifying this but we can observe that in Arp's catalog of anomalous quasar/galaxy associations, relatively few of the examples have 5 or more quasars in the field. Therefore, I think it's conservative to assume that only half the quasars are in groups of 5 or more near galaxies. You would agree, right? In fact, I think this is very conservative assumption, otherwise Arp's list of anomalous quasar/galaxy associations would have likely contained far more examples with large numbers of quasars. In any case, I'm going to reduce the number of quasars available to comprise the population of galaxies that have 5 quasars by half ... to 103,000. Now if you divide that number by 5, that means there are at most 20,600 galaxies visible that have 5 quasars in their vicinity.
.
Earlier you introduced a paper by L-C&G, which presented some rather concrete numbers of just what you are trying to estimate; why not use what's in that paper?

In any case, an imporant error in your work is, as I have said, conflating what Arp, Chu, et al. found with what's reported in large surveys ... without going into the nitty-gritty of how comparable the methods of estimation are.

(to be continued)

PS NGC 3516 is outside the coverage area of SDSS DR6 (the latest), and it certainly was not observed in the 2dF survey! (this galaxy has a Dec of +72!)
 
Here you can see a picture made by the VLT where there is this blurring and hazy effect from the exposure, caused by scattering amongst other things.
http://antwrp.gsfc.nasa.gov/apod/ap011021.html

DD, what blurring and haziness are you referring to? Are you talking about the extended halo around the Sombrero? Because, if you are, that is not an artifact, or blurring. That is the extended outer halo of stars around the galaxy. It is very pronounced, due to the high S/N of this image, and due to the non-linear contrast stretch used on this image. Make no mistake, though, the halo is made up of Sombrero stuff.

here is one that due to resolution is even more apparent what blurring by exposure can look like (it is down at the bottom) also look there is a blue ring.
http://images.google.com/imgres?img...brero+galaxy&start=20&ndsp=20&um=1&hl=en&sa=N

Again, there is no blurring here. Just a very high S/N ratio caused by the extended exposure time obtained for this image.

and here is one where the effect is compensated for but is still there to some extent
http://antwrp.gsfc.nasa.gov/apod/ap080308.html

The S/N on this image may not be as good, or it is also likely that the contrast was not as "stretched" as in the other image.

I don't think that there is any "effect" at work here, just the star-stuff associated with the galaxy. The only effect is the S/N in the image, and the amount of post-processing applied to the image.

Now I am very curious how the authors came to the conclusion that background objects were not visible , due to this artifact?

They simply state: "There are no signs of background objects showing through the disk in this HST picture
of the inner regions of NGC 7319".

They also go on to show absorption lines, and reddening of the QSO, both indicative of some sort of matter between us and the QSO.

Spiral galaxies are not that dense in their rotational plane, even this close to the nucleus.

Why wasn't a spectrum taken of the stellar object just to the lower right of the QSO. It may be a foreground star, but maybe it is not?

I think that the evidence I see points to the QSO being at the distance indicated by it's redshift.
 
Okay, so I am wrong. Figures.

I will state it for the lurkers, I was wrong.

I really thought there was some scattering and blurring going on. But if it is the single stars showing because of long exposure that is even cooler.

I guess I am old fashioned, thinking like film and the foreground tars burning into the picture.

Sigh, I remember when we only had a balck and white TV. And no microwave.
 
Bill Keel did an extensive study of the optical depth of the arms of (bright, big) spiral galaxies, using some pretty clever methods.

He concluded, in a series of papers on this topic, that it is rare to find any part of any arm of a spiral that has an optical depth of >1.

Too bad you didn't see fit to provide us with a link to those papers. But that's ok ... I found Keel's papers. And now I know why you didn't. Because they show you either misinterpreted Keel's conclusions or you are misrepresenting them.

The story starts with the findings of Edwin Valentijn back in 1990: http://findarticles.com/p/articles/mi_m1200/is_n2_v138/ai_9221687 "Casting shadows on spiral galaxies, Science News, *July 14, 1990 *by Ivars Peterson ... Reporting in the July 12 NATURE, Edwin A. Valentijn of the Kapteyn Astronomical Institute in Groningen, the Netherlands, suggests that major parts of most spiral galaxies are heavily clogged with light-absorbing dust. In many cases, the dust enshrouding the inner parts of a galaxy appears so thick that astronomers actually see only the outer crust of stars. ... snip ... The old view that spiral galaxies are largely transparent arose from studies of how the average surface brightness of galaxies differs depending on whether an observer sees a galaxy face-on or tipped at an angle. Dust-free, transparent galaxies would have comparable luminosities when viewed from any direction, whereas dust-clogged galaxies would look brightest observed face-on. Valentijn originally set out to determine what factors may have biased the original studies of spiral-galaxy transparency. His precise measurements of the brightness of more than 12,000 carefully selected spiral galaxies revealed that these galaxies appear much more opaque than earlier studies had indicated. "I was very surprised because the results contradicted many famous papers in this area," Valentijn says."

In 1998, William Keel and Raymond White published this: http://www.astr.ua.edu/keel/research/aasdust.html "COSMIC SILHOUETTES GIVE RARE GLIMPSE OF GALAXIES' DUST ... snip ... The investigators presented images ... snip ... of two striking pairs of galaxies, each with a spiral galaxy in front of a smooth elliptical companion. ... snip ... the astronomers did see what they expected to find, that the dust is patchy and clumped, largely aligned along the spiral arms. "Having most of the absorbing dust in the spiral arms, where most of the light originates, is what caused the statistical studies to wrongly conclude that spirals are opaque," says White." And while that report states "The dustiest patches that appear in the HST images aren't very dark, since at least 20% of the blue light comes through, and even more of the near-infrared light," the foreground galaxy has little similarity to the NGC 7319. NGC 7319 looks like this:

http://ucsdnews.ucsd.edu/graphics/images/2004/spiralgalaxy.new.gif

The foreground galaxies (AM1316-241 and AM0500-620) studied in this paper look like this:

http://apod.nasa.gov/apod/image/9801/am1316_hst.jpg

and

http://www.smv.org/hastings/350kbg.jpg

As you can see, they weren't looking through material anywhere near the core of the foreground galaxies.

In fact, this Keel paper goes on to say "These galaxy pairs only tell us about their outer regions, where the backlighting is strongest; the inner parts of galaxies, richest in heavy chemical elements and perhaps in dust, are much more difficult to explore."

Now of course, the series of papers you were probably refering to are the ones titled "SEEING GALAXIES THROUGH THICK AND THIN", of which this is the first paper:

http://www.journals.uchicago.edu/cgi-bin/resolve?ApJ35086PDF "SEEING GALAXIES THROUGH THICK AND THIN. I. OPTICAL OPACITY MEASURES IN OVERLAPPING GALAXIES, Raymond E. White III, William C. Keel and Christopher J. Conselice, THE ASTROPHYSICAL JOURNAL, 542: 761-778, 2000 October 20" .

And here is what this paper actually says about opacity:

"Even though typical spirals are not optically thick throughout their disks, where they are optically thick is correlated with where they are most luminous: in spiral arms and inner disks. This correlation between absorption and emission regions may account for their apparent surface brightness being only mildly dependent on inclination, erroneously indicating that spirals are generally optically thick. (BAC - DRD, this last statement is what Keel et. al. were actually arguing against, not your claim that spiral arms are not optically deep.) Taken as an ensemble, the opacities of spiral galaxies may be just great enough to significantly affect QSO counts, though not enough to cause their high redshift cutoff. ... snip ... In the following discussion of individual objects, we will tend to quote magnitudes of extinction A rather than optical depths Tau, where A = 1.086Tau. ... snip ... As reported in White & Keel (1992), our best case thus far is AM1316-241, an Arp-Madore catalog object consisting of a foreground Sbc projected against a background elliptical. ... snip ... The opacity is clearly concentrated in the spiral arm, while the interarm region is nearly transparent. ... snip ... The E/Sbc pair AM 0500-620 shares some of the favorable characteristics of AM 1316-241 — it is comprised of a relatively undisturbed foreground spiral and a symmetric background elliptical ... snip ... along the arm ridge line, we find AB > 3.0 and AI = 2.1, while the interarm extinction ranges over AB = 0.1 - 0.6 and AI = 0 - 0.7 at various points seen against the elliptical ... snip ... The Sbc pair NGC 4567/8 (UGC 7777/6) is another case where the analysis is limited by the general lack of symmetry ... snip ... Here we concentrate on the dark lane in the upper left of Fig. 5a which cuts across a brighter background galaxy arm. ... snip ... We calculate face-on extinctions of AB = 1.1 and AI = 0.69 for this region ... snip ... This somewhat strengthens our interpretation of the excess light as indeed shining through a more transparent interarm medium. ... snip ... UGC 2942/3 This is a pair of highly-inclined spirals, with the background galaxy seen only a few degrees from edge-on ... snip ... To estimate the extinction in the foreground spiral UGC 2942, we consider intensity slices perpendicular to the projected plane of the background galaxy UGC 2943. ... snip ... The implied optical depth across the spiral arm (within the dust lane) is of order TauB = 3. ... snip ... NGC 3314 NGC 3314, a remarkable superposition of two spirals in the Hydra cluster (Abell 1060), was considered in the context of opacity measurements by Keel (1983). ... snip ... this system is uniquely valuable because we can estimate extinctions in the foreground galaxy closer to its center than in any other of our sample. ... snip ... The best places for reliable extinction measurements are the points where the arms of NGC 3314a cross the disk edges of NGC 3314b, going from projection against the bright disk to projection against almost blank space at essentially the same radial distance for the arm. We measured the arm intensities at adjacent points on and off the background disk, after subtracted a minimal exponential-disk model to flatten most of the background gradient (so that interpolation to get the relevant unobscured background intensity is better constrained). For two locations where the arms cross the disk at about 0.5R25, both AB and AI are comparable at 1.8, while the interarm regions average AB = 0.60 and AI = 0.34. ... snip ... Summary and Discussion We have presented absolute extinction measures for 11 spiral galaxies in overlapping pairs. For each pair, there is some range of radii for which we can measure the residual intensity of background light transmitted through the foreground disk. We translate these measures into arm and interarm extinctions (where such a distinction is possible) in both B and I bands. In almost all cases, there is a large difference between arm and interarm values. In arm regions, AB ~ 0.3 - 2 and AI ~ 0.15 - 1.4[/b], while in interarm regions, AB ~ 0.07 - 1.4 and AI ~ 0.05 - 1.3. ... snip ... The arm and interarm plots are drawn to the same scale to emphasize that arm regions tend to be much more opaque than interarm regions. ... snip ... The interarm (“disk”) extinction tends to decline with radius (Fig. 12b) from AB values of only ~ 1 magnitude within ~ 0.3R25 . In contrast, spiral arms and resonance rings can be optically thick at almost any galactocentric radius. ... snip ... Our initial results on AM1316-241 (White & Keel 1992) led us to conclude that disk opacity is concentrated in spiral arms and that interarm regions are fairly transparent. Our newer work is generally consistent with this picture, with resonance rings found to be as optically thick as spiral arms. Therefore, the distribution of absorption tends to be spatially correlated with particularly bright regions, since spiral arms are brighter than interarm regions. We suggested (White & Keel 1992) that this spatial correlation between internal extinction and emission may account for the statistical results reported in earlier studies — that surface brightness is roughly independent of inclination. The dust is optimally placed to affect global blue photometric properties, since typically half the disk light comes from only about 20% of its area, accounting for the rather flat inclination-surface brightness relation, without requiring galaxies to be optically thick in interarm regions. ... snip ... Since our measurements are based on spatially averaged transmission values, the “effective” extinction may not be fully comparable to the extinction curves derived from what are essentially point sources in our own and nearby galaxies. ... snip ... Our results bear on the question of whether the high-redshift “QSO cutoff” can be produced by absorption in spirals along the line of sight. ... snip ... For a fiducial set of spiral galaxy parameters, Ostriker & Heisler (1984) estimate that 50% of QSOs at z = 4.5 will suffer such obscuration by foreground galaxies; this is close enough to the characteristic peak redshift in the QSO distribution at z ~ 2.2 to make obscuration effects worth investigating. We find that disks are optically thin in spiral types Sb and later, which have AB < 1 from 0.5 to 0.9 R25; extinctions are below our measurement errors for R > R25. The typical interarm behavior of our sample is very close to the model adopted by Ostriker & Heisler (1984), except that we find extinctions (at B) less than they assume by factors always greater than 2. Their fiducial model is based on the radial structure of the Milky Way and the integrated extinction perpendicular to its disk at the solar location R ... snip ... This implies that the Ostriker & Heisler model has AB = 0.9 at 0.5R25, in contrast to the AB = 0.1-0.4 values we find for interarm regions at similar radii. Spiral arms will provide additional absorption, but they cover rather less than half the surface area in grand-design spiral disks. The covering fraction of spiral arms tends to be larger in flocculent spiral galaxies, however. ... snip ... While detailed calculations of this effect based on local galaxies may not be relevant to the high-z objects responsible for most of the cumulative extinction, we do note that a two-component model treating arm and interarm regions separately should reflect local reality much better than a single-zone scheme ; most spiral arms are opaque enough to drop a QSO out of observed samples, but the half (or more) of a disk between dusty arms remains usefully transparent over much of the disk's projected area..

And in case you missed what is stated by Keel above, the magnitude of extinction, A, equals 1.086 times the optical depth. Thus, if A > 1.086, the optical depth is greater than 1. So numerous examples are provided above where in the arms of the spirals the optical depth is greater than 1, even much greater than one. And based on the number of such examples in the above paper out of all the cases it examines, one would have to conclude finding optical depths greater than 1 in the arms of spirals near the core is NOT a rare thing at all. So you see, DRD, they did not conclude what you claim they did. If fact, I don't think you even read the paper. Is that how you typically conduct your research? Or were you just too busy working on your study of trolls and their effect on thread length to read it? :)

And note that the case they said was "uniquely valuable because we can estimate extinctions in the foreground galaxy closer to its center than in any other of our sample. looks like this:

http://www.utahskies.org/image_library/deepsky/ngc/ngc3314.jpg

That foreground galaxy doesn't look anywhere near as dense as NGC 7319. I think you're hand-waving, DVD.

And here's what the fourth paper in Keel's series says:

http://www.astr.ua.edu/preprints/keel/index.html "Seeing Galaxies through Thick and Thin. IV. The Superimposed Spiral Galaxies of NGC 3314 by William C. Keel and Raymond E. White III, in press in the Astronomical Journal for September 2001." ... snip ... "Using a larger sample of 12 suitable backlit spirals, White, Keep, & Conselice (2000; WKC) found this to be representative behavior: arms and resonance rings can have substantial opacities (TauB at any radius ... snip ... In the innermost few hundred pc, even the most transparent regions between dust lanes show AB ~ 7 and there are dusty arms with AB > 8.2. "

Again, remember that A > 1.086 is an optical depth of 1.0, so it appears the arms near the core of spirals can be VERY opaque.

The Einstein Cross, or QSO 2237+0305, is a background quasar lensed by a foreground galaxy ... and it is 'seen' right through the densest part of ZW 2237+030.

Let's just show folks what that "supposed" foreground galaxy looks like in this case, shall we?

http://apod.nasa.gov/apod/image/0703/qso2237_wiyn.jpg

And note that the 4 components of the Cross are reportedly separated by 0.9 arc seconds. That compares to a separation of the NGC 7319 quasar from the core of 8 arc seconds. So the entire galaxy you see in your example has about the apparent radius of the distance from the nucleus of NGC 7319 to its quasar.

By the way, Arp claims that the Hubble Space Telescope images show connecting material between one of the quasars (D) and the central galaxy and a high redshift connection has also been discovered between quasars A and B, passing in front of the connection between the nucleus and quasar D. Plus, the brightness of the four quasars was observed to increase over a period of several years from 1991 to 1994. Arp's explanation is that the galaxy has ejected four quasars, which are growing brighter with age as they move farther from the nucleus.

And here's a paper, http://vela.astro.ulg.ac.be/themes/dataproc/deconv/articles/q2237/q2237.html#len , that concludes one quasar image's light is being absorbed and reradiated by dust ... which might be the case if the quasars are actually separate objects embedded in the host galaxy but unlikely in a lensing case. Chandra observations also indicate that object A has a broad emission line in the Fe/K alpha while objects B,C,D do not. How can this be with a single lensing galaxy? Afterall, according to NASA (http://hubblesite.org/newscenter/archive/releases/1995/43/text/ ), "it is impossible to identify the true gravitational lenses without observations which show the two objects have exactly the same spectral fingerprint and so are "multiple" images of a single object." Apparently, these don't.

Do you mind if I ask you how you go about evaluating the thousands of papers, written by hundreds (or more) of other astronomers, who find that quasars are at distances implied by their redshifts (per the Hubble relationship)?

Funny how these hundreds of astronomers have nothing to say in the case of NGC 7319. The silence is deafening. :D
 
The sticking point is that BeAChooser does not believe in the existence of dark matter at all.

That's not true. I have no problem with baryonic dark matter. I've said that many times.

And it's because certain posters keep mischaracterizing what I actually said that I choose to ignore some of the efforts to debate me on certain threads after basically everything has been said that needs to be said and after I've been repeatedly insulted on those threads. So if I wish to discuss dark matter then I will visit that thread you mentioned. But I would appreciate your confining your remarks on this thread to the matter of redshift and observations that suggest redshift might not equate to distance in all objects. For example, would you like to comment on my calculation regarding the improbability of so many redshifts in quasars near certain galaxies that are close to the Karlsson values? Or do you have something to add regarding NGC 7319 and the quasar that appears to be on this side of it?
Then I must have misunderstood your "hosts of gnomes" objection to the dark matter observation in the Bullet Cluster. It was not referring to the dark matter, it was just the one gnome about the distance to the Bullet Cluster as measured by redshift.

I am not an expert in statistics but I will look at your calculation about "improbability of so many redshifts in quasars near certain galaxies that are close to the Karlsson values". It looks plausible at first glance but so many statistical calculations do and many posters seem to disagree with the calculation.

As for NGC 7319: The quasar looks as if it is shining through the galaxy. If all galaxies were opaque throughout their structure then this would mean that the quasar is in or in front of the galaxy. But galaxies are not solid so there is always the possibility that we are looking through a hole like the Lockman Hole. However it is unlikely to be in front of the galaxy since the Pasquale Galianni, et. al. paper states that the QSO spectrum has absorption lines in it consistent with the gas in the galaxy.
This is definitely not an issue that will be resolved in this forum. As the authors conclude:
More studies are required, since this is the only system found so far in which there is the possibility of demonstrating more clearly that the QSO and galaxy are interacting.
 
And here's a paper, http://vela.astro.ulg.ac.be/themes/dataproc/deconv/articles/q2237/q2237.html#len , that concludes one quasar image's light is being absorbed and reradiated by dust ... which might be the case if the quasars are actually separate objects embedded in the host galaxy but unlikely in a lensing case.

I am not sure how you differentiate these two cases, BAC.

Why would different absorption be plausible for separate objects, but not plausible for lensed images?

The only way it is plausible for separate objects is if they are in differing areas of opacity.

The same difference in opacity would also be reflected in the lensed images.
 
Just a quick note to thank BAC for the lengthy reply, to say that it's good to see Reality Check, DD, and Wrangler beginning to engage BAC on the specifics, and that I may not be able to post for a couple of days or so ...

Also, if anyone is sufficiently interested, perhaps you'd like some suggestions on where to go to get more detailed, in-depth info on astronomy (etc), and a suggestion that I don't think this JREF forum is quite set up to cover parts of the issues and questions raised here ...
 
As for NGC 7319: The quasar looks as if it is shining through the galaxy.


One quick comment,,,

You may beable to pass off one as a mere co-incidence, but, for example, Galaxy NGC 7603 has two definate small quasar like objects clearly at both points in the plasma filament connecting the quasar to the galaxy. Both have very different Redshifts.

Theres a picture of it about twenty seconds into this documentary, with various astronomers talking about it;

http://www.youtube.com/watch?v=EjQVybreSUs
 
Originally Posted by Wangler
1) It seems as if a posteriori statistics are used in astronomy perhaps more often than in other technical fields.

However, if we're talking about astronomy and astrophysics, as branches of science, then 1) starts too far from the beginning to be of much help, and so the rest become not so interesting ...

Having a bit of trouble explaining away the calculations I did? ;)

Originally Posted by Wangler
3) With 2) being stated, there are some apparently unique associations between some QSOs and some bright galaxies.

In any case, 3) does not depend on 1) or 2) ... and unless it is much, much more tightly qualified is so boringly, obviously true that we need not waste any more time on it.

Having a bit of trouble explaining away the calculations, DRD? :)

Of course, every 'association' between any set of quasars and any set of galaxies (whether bright or not) is unique! What I think you may have intended to say is something about a general pattern, a relationship between a tightly defined subset of quasars and galaxies.

You are wrong. In the calculation I did, I did not limit myself to a "tightly defined subset of quasars". On the contrary, I used mainstream science's own observations and studies (extensive ones, btw) to estimate the TOTAL number of quasars that might be seen in the sky. I calculated the probability of seeing those two specific cases identified by Arp if one were to examine the ENTIRE population of quasars and galaxies. Furthermore, I made some highly conservative assumptions (from the standpoint of maximizing the likelihood of the observations) regarding the distribution of these quasars around galaxies and quite reasonably treated the probability of finding quasars near specific Karlsson redshifts together in one location. Finally, I did the same thing in calculating the probability of quasars aligning themselves in such numbers along the minor axis of galaxies too. I looked at the probability assuming one could examine the entire population of quasars and galaxies.

Those calculations show that finding either of the two observed cases (and Arp found additional others like them) was exceedingly unlikely even if Arp had (and he did not) examine every single quasar in the sky. The fact that he found so many highly improbable cases after examining only a small fraction of the total quasar/galaxy population only increases the improbability of the mainstream's assumption that high redshift quasars have no relation to low redshift galaxies being correct.

This pattern could be something derived from a theory, such as the non-existent one BAC refers to

Regardless of whether you accept the Narlikar/Arp notion that quasars are ejected from galaxies and increase in mass over time while decreasing in redshift, the Bayes' Theorem calculation I did mathematically proves there is probably another explanation than the mainstream's for these observations. Right now the mainstream isn't even looking at the possibility that quasars have a relationship of some sort to low redshift galaxies. They are doing what you are demonstrating here ... waving their hands ... or worse, simply refusing to discuss calculations and observations like the ones I've presented.

However, the whole chain (above) can be short-circuited by asking two, very simple, questions:

a) what is a 'quasar'?

b) are 'quasars' a homogeneous class of objects?

You are wrong again. In the calculation I did, it doesn't matter what a quasar "is" ... as long as it has a high redshift and is near a low redshift galaxy. It could physically be anything and STILL the probability of finding large groupings of them aligned along the minor axes of low redshift galaxies and with redshifts near specific Karlsson values would be astronomically small under the mainstream theory that they can have no connection whatsoever to those low redshift galaxies. The reason you (and the mainstream) don't want to honestly consider that possibility is that if redshift can be shown not to always equate to distance, then most of Big Bang cosmology's theories regarding the meaning of observations are going to need careful reexamination.
 
how was NGC 3516 selected?

You are handwaving because that doesn't matter as far as my calculation is concerned. The calculation is independent of whether NGC 3516 was found or not. The calculation simply determines the probability of that particular configuration being found amongst the entire population of quasar/galaxies that we could observe assuming the mainstream's theories. And that probability is exceedingly small. So the fact that Arp found that case (and several others like it) after relatively few observations (compared to the total number of quasar/galaxy associations in a sky filled with literally billions of galaxies) should be a warning flag that something may be wrong with the mainstream's theories.

how many 'near NGC 3516 quasars' were known before Chu et al. planned their observations?

Again, that's handwaving because when the quasars were found doesn't affect the calculated probabilities in ANY way and because like or not there are 5 quasars with redshifts suspiciously close to Karlsson values aligned with the minor axis of NGC 3516 and no other objects identified as quasars in the observed field.

how are quasar redshifts distributed, in [0,3]? If they are not distributed equally (to within some bound), then probability calculations need to reflect that non-equal distribution.

I addressed that question. As I said, the frequency of redshifts is not constant over the entire range. Based on recent mainstream sources it looks like it rises from a finite value (about 1/8th of the max) near z=0 to a max at about z=1 to 1.5, then levels off till around z=2.5 to 3.0, where it precipitously drops reaching a value of only 1/40th to 1/50th the maximum at z=0.6. Thus, the low z data points (say below z = 1) are overweighted in my calculation compared to the higher z values in the range 1 to 3. That would affect the overall calculation more significantly if we observed that the separation between observed redshifts and Karlsson values as a percentage of their spacing between Karlsson values remained constant or trended upward or downward. But it doesn't. That spacing as a percentage goes up and down from point to point. Finding this effect is fairly involved but we can at least gage whether ignoring this in the calculation is conservative.

In the case of NGC 3516, observed z = 0.33, 0.69, 0.93, 1.40, 2.10. The Karlsson z = 0.3, 0.6, 0.96, 1.41, 1.96, 2.64. Therefore, the spacings are +0.03, +0.09, -0.03, -0.01, +0.14 which, as a percentage of the distance between the two nearest Karlsson values are 10%, 25%, 8%, 2%, 20%. Thus, the first two values with separations from the Karlsson value of 10% and 25% are overweighted, compared to the ones that have separations of 8%, 2% and 20%. That means in the calculation involving the three quasars with the lowest separations, the two lowest separations are underweighted compared to the highest separation of the three. Meaning that the corrected probability from that calculation would be lower than was calculated. And in the two separate calculations to account for effect of the other two quasars, one of the two is somewhat overweighted but the other may be slightly underweighted. So I assert that incorporating this factor into this particular calculation would LOWER the final probability from the value I determined.

In looking this over for the NGC 5985 case, I find I made a mistake in the previous calculation. The observed z = 0.35, 0.59, 0.81, 1.97, 2.13. The spacings are therefore +0.05, -0.01, -0.15, +0.01, +0.17. In the previous calculation, I used a separation of +0.03 for the last data point instead of +0.17. That effects the calculation in a number of ways, so I'm going to redo the whole calculation before addressing the z distribution evenness issue.

Now we could do the same as before and simply calculate the combinatorial probability of finding the lowest three spacing data points, z= 0.35 (+0.05), 0.59 (-0.01) and 1.97 (+0.01). In that case, the required increment would be 0.10 and the probability would be 1/((30 * 29 * 28)/(3*2*1)) = 2 x 10⁻⁴.

But that might significantly overestimate the probability since two of the data points are within an increment of only 0.02. So what's the combinatorial probability of finding 2 data points with a increment of 0.02? The answer is 1/((150 * 149 )/(2*1)) = 9 x 10⁻⁵. Which is less than the above estimate so let's use it.

Now we add in the effect of the 0.35 (+0.05), 2.13 (+0.17) and 0.81 (-0.15) values. The probability of seeing the 0.35 data point with a increment of 0.10 is about 1/30 = 0.033; the probability of seeing the 0.81 data point with a increment of 0.30 is about 1/10 = 0.1; and the probability of seeing the 2.13 data point with an increment of 0.34 is about 1/8.8 = 0.11. Combined, these would reduce the 9 x 10⁻⁵ probability estimate to only 3 x 10⁻⁸.

Next, we must account for the actual number of quasars that might be seen near galaxies in groups of the size needed to do the above calculations. Previously, I found that the mainstream estimates there should be a total of about 410,000 quasars in the sky. And I then assumed (very conservatively, I think) that only half are near low redshift galaxies. That left us with 205,000 quasars to distribute. Then I assumed (again, very conservatively) that half of these would be distributed in quantities less than five to all the galaxies available, leaving 103,000 that are in groups of 5 near low redshift galaxies. Dividing by 5, the final result was 20,600 galaxies with at least 5 nearby quasars. Multiplying the above probability by 20,600 yields a probability of 5.4 x 10⁻⁵.

It's at this point, however, that I notice another possible complication in my previous procedure. Since about half of the 3 x 10⁻⁸ probability comes from only 2 quasars being together near a galaxy, the number of galaxies that might have 2 quasars is larger (by 2.5 times). Thus, the importance of those 2 quasars could be improperly diminished if I assume 20,600 as the total number of galaxies. Thus, we can expect an UPPER BOUND of 5/2 * 5.4 x 10-5 = 0.000135 for the probability at this stage of the calculation. Let's conservatively use that.

Finally, we add in the fact that all 5 of these objects are aligned with the minor axis. As before, the alignment probability reduces the likelihood by 0.08, giving a final probability value of 0.000135 * 0.08 = 1.1 x 10⁻⁵ for the NGC 5985 case.

(By the way, accounting for an increase in galaxy sample size in the NGC 3516 case because much of the probability only depends on 3 quasars, one can estimate an upper bound probability of 5/3 * 0.0005 (the original probability in that case) = 0.00083 ... a very, very small likelihood of that case turning up at all if we were somehow able to check every single quasar thought to be visible in the sky.

Now let's examine your concern about the z distribution in the NGC 5985 case. The percentage of distance between the two nearest Karlsson z values for the z = 0.35, 0.59, 0.81, 1.97, 2.13 observations are 16%, 3%, 42%, 1%, 25%, respectively. In this case, the 16%, 3% and 42% data points are overweighted, while the 1% and 25% data points are underweighted. In the two quasar calculation (which used z=0.59 and 1.97), the 3% value is somewhat overweighted. This would increase the probability at least a bit ... perhaps a factor of 2? But counteracting this is that fact that the z = 0.35 data point with a very large increment is underweighted. Likewise the z = 0.81 data point with an even bigger increment is also underweighted. But if you like, I'll still give you that factor of 2. In which case, the final probability of seeing NGC 5985, if one could check every single quasar out there, would only be 2 x 10⁻⁵ ... again a VERY small number.

Any way you cut it, DeiRenDopa, this calculation proves that the mainstream's theory about quasars is on shaky ground. They need to reexamine that theory in light of this data or come up with an explanation why redshifts seem to be quantized around certain values and show up with a higher than expected frequency around galaxies along their minor axes. Or one has to illogically believe that Arp was REALLY LUCKY in turning up 2 cases with likelihoods of only 0.0008 and 0.0002 even if all the galaxies in the sky with quasars could be examined (which he didn't come close to doing).

your calculation, on its own, would seem to apply to any set of three numbers in [0,3]

No, the three numbers that turned up aren't just any three numbers, are they. They are all close to values that were determined without any reference to the data in these particular samples. Or so I believe. :)

As I noted earlier, if the range is [0,3], then all the Karlsson values in that range need to be included.

And as I noted in my response, there is nothing in the theory that requires quasars be at all the Karlsson values around any given galaxy at any one time.

Beachooser wrote:
Here's a 2005 study http://www.iop.org/EJ/abstract/1538-3881/129/5/204 that indicates an average density of 8.25 deg-2 based on the SDSS survey then argues it should be corrected upward to 10.2 deg-2 to make it complete. And if you go to the SDSS website (http://www.sdss.jhu.edu/ ) you find they say the effort will observe 100,000 quasars over a 10,000 deg2 area. That also works out to about 10 quasars deg-2. So it looks like I used a number that was 3 times too large in my earlier calculation. In this revised calculation, I will only assume the average quasar density is 10 deg-2. That means the total number of quasars than can be seen from earth is around 410,000.

The Chu et al. paper carefully explains how they chose which objects to observe (in order to measure redshifts); the "average density" of quasars you need to use in this part of your calculation is that which would be obtained if the search method used in Chu et al. were to be used over the whole sky. As there appears to be no effort to explain this, in any quantitative fashion, let alone estimate it, you are left with an unknown.

Let me emphasize that my calculation actually has nothing to do with the Chu et. al. paper. If you don't like the "average density" of quasars that I used for all the quasars in the sky (i.e., 10/deg2), then I'll make you the same offer I made to David. You provide that number and we will just insert it in the calculation and see what we get. I used 10/deg2 because the SDSS study and website says that's the average density. It's why they indicate there are in total about 400,000 quasars in the visible universe. If you want me to use whatever Chu claimed is the average density over the ENTIRE sky, then just tell us what Chu says that is. But be prepared to justify it, if it happens to disagree with the SDSS estimate. After all, the SDSS estimate is based on the most complete study of quasars that is available (you folks kept telling me that) and papers have been published by mainstream astronomers that in fact conclude the SDSS study is very close to complete in it's identification of the quasars that are out there in the section of the sky that was surveyed). If you don't like the assumption that the density of quasars in the quarter of the sky that was surveyed is the same as the density in the three-quarters that was not surveyed ... take it up with the SDSS authors. :) Frankly, I think you are just doing more hand-waving ... now desperate to avoid accepting what is a rather obvious conclusion for this set of calculations. :D
you need at least a measure of the variation in average density (as well as the average density), to make the sorts of estimates this part of calculation aims to do.
No, I don't. The results of my calculation are not affected by the fact that more quasars might be located in one little area of the sky than in another, as long as the average density of the entire sky is 10/deg2. The total number of galaxies with 5 or more quasars (or 2 or 3 in the later calculations) near them will remain the same. Somehow, I think you aren't conceptualizing the true nature of this calculation.
BeAChooser wrote: But the truth is that most quasars do not lie close to galaxies at all (certainly not galaxies where we can discern any detail as is the case in all three examples of interest here) so that's why I later multiplied the calculated probability by 0.10 to account for the assumption that only 10% of quasars lie next to a galaxy. I still think that's probably a reasonable number. But for this calculation, I'm going to give your side the benefit of the doubt and assume that fully half of all quasars are near galaxies. That has to be very conservative. Wouldn't you agree. So now there are 205,000 in the population that we need to distribute amongst galaxies. Making up numbers, and using one's intuition about what's conservative, reasonable, etc, in astronomy is an almost certain way to be wrong.
Do you honestly think that more than half of quasars lie near low redshift galaxies? Care to prove that? Do you have ANY basis for thinking that? The fact that Arp could only come up with a limited number of anomalous associations, after studying what must have been thousands of cases, seems proof enough that more than half of quasars must not be near low redshift galaxies from our viewing perspective. But I tell you what, if you have evidence that the percentage is higher than 0.5, then just offer it. Don't be coy. We can factor that into the calculation of probabilities and see what happens. :) Or maybe there's another way we can come up with an estimate of the number of galaxies we need to consider as being near quasars. What we need to know is the number of galaxies that are low redshift ... say within a redshift of about 0.01 (since both of the cases in my calculation have redshifts less than that value).
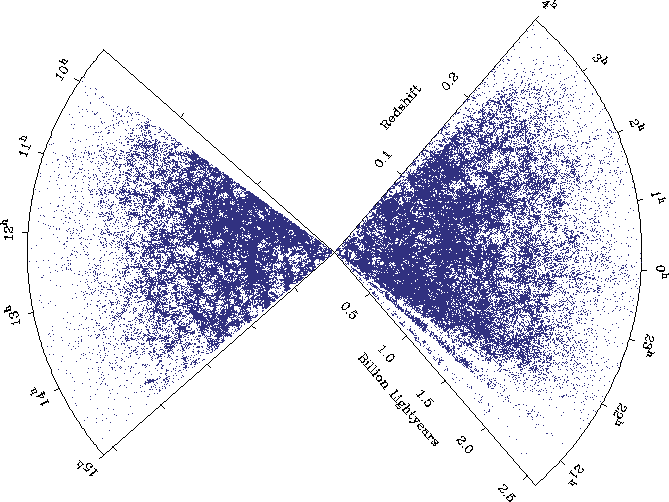
 This
galaxies_2dFGRS_big.gif
shows galaxies versus redshift in the 2dF survey. According to the NASA APOD text, there are about 200,000 galaxies in that sample. According to this; http://www.mso.anu.edu.au/2dFGRS/ , the area surveyed was approximately 1500 deg2. Now looking at that plot, I visually estimate that the density is roughly constant out to a z of about 0.15 . The percent area that the z=0.01 zone occupies in the z=0.15 region is PI * (0.01/0.15)2 = .014. Probably a third again as many galaxies lie outside the z=0.15 region in that image. So the number of galaxies within z=0.01 is probably no more than 1 percent of 200,000. So within a 1500 deg2 surface, there would be .01*200,000 = ~ 2000 galaxies. Which means there are about 1-2 galaxies per square degree. According to one source I found, most of the galaxies in near-field surveys are smaller than 30 - 40 arcsec, meaning they occupy only a small fraction of any given square degree field (because one arcsec is 1/3600 of a degree). Another source noted that even in galaxy groups, the distance between member galaxies is typically 3-5 times the diameter of the galaxies. Even the giant Whirlpool galaxy, which was the first to show a spiral form, only has an apparent diameter of 10 arcmin. Even the naked eye Andromeda galaxy, M31, our nearest neighbor only has an apparent diameter of 180 arcmin in it's largest dimension. NGC 3516 has a apparent diameter of only a few arcmin. So with only 10 quasars per square degree of sky on average, it would seem there would be plenty of room for quasars that are not associated with local, low redshift galaxies. Or do you wish to contest this further? :)
Earlier you introduced a paper by L-C&G, which presented some rather concrete numbers of just what you are trying to estimate; why not use what's in that paper?
Are you saying I should use their estimate for the average quasar density per square degree of sky? Or their estimate of what fraction of the quasars are actually within a degree of galaxies? Or their estimate of what fraction are in quasar/galaxy associations with 5 quasars per galaxy? Did they actually estimate any of those numbers? I don't recall seeing it in the paper. If you see those numbers, please point them out to me.
 
A series of posts on questions that remain unanswered.

In other words, a desperate attempt to obfuscate your growing problelm on this thread? Perhaps we should stick to the calculation I offered until you convince everyone there is no problem? If you can't, perhaps then we can focus on identifying a viable alternate solution. :)
 
They also go on to show absorption lines, and reddening of the QSO, both indicative of some sort of matter between us and the QSO.

But they also point out they aren't as much as one would expect if the quasar were on the other side of the galaxy and that a quasar ejected on this side could still be within the bounds of the galaxy and subject to some absorption.

Spiral galaxies are not that dense in their rotational plane, even this close to the nucleus.

That was not the conclusion of the Keel reports that I had tossed at me. Go read them ... even the face on cases had very high A in the arms near the nucleus.

I think that the evidence I see points to the QSO being at the distance indicated by it's redshift.

Then one would think that one of the hundreds of astronomers that DRD claims believes that would see fit to say so in print. :D
 
Then I must have misunderstood your "hosts of gnomes" objection to the dark matter observation in the Bullet Cluster. It was not referring to the dark matter, it was just the one gnome about the distance to the Bullet Cluster as measured by redshift.

Again, another misrepresentation of what I quite clearly stated. That's why I'm not going to go back and address this issue with you, RC. It makes no difference what I actually say, you will just misrepresent it.

I am not an expert in statistics but I will look at your calculation about "improbability of so many redshifts in quasars near certain galaxies that are close to the Karlsson values". It looks plausible at first glance but so many statistical calculations do and many posters seem to disagree with the calculation.

And so far not one of their complaints has stood the test. In fact, the concerns they've raised when I actually tried to address them more carefully have had the effect of lowering the expected probabilities even further. ;)

As for NGC 7319: The quasar looks as if it is shining through the galaxy.

Funny, I cited a number of astronomers who say just the opposite and so far your camp hasn't managed to name even one who has said that's not the case in print. And most definitely not in anything that is peer reviewed. :)

But galaxies are not solid

But as I showed using the Keel papers, they do tend to be optically opaque along the arms and near the nucleus ... where this quasar actually lies.

However it is unlikely to be in front of the galaxy since the Pasquale Galianni, et. al. paper states that the QSO spectrum has absorption lines in it consistent with the gas in the galaxy.

But it's also pointed out that the lines are not as strong as would be expected if it were shining all the way through the galaxy and that even if it were on this side it would likely still have to shine through some of the galaxy's gas.
 
Again, another misrepresentation of what I quite clearly stated. That's why I'm not going to go back and address this issue with you, RC. It makes no difference what I actually say, you will just misrepresent it.
The full posting I "misrepresent" is here and is actually about this topic. The applicable paragraph is:
David and his friends on this forum like to go on and on about dark matter being directly "observed" in the case of the Bullet Cluster ... even though there are a host of gnomes and assumption based calculations implicit in that so-called observation. Yet, the 2003 discovery of a high redshift (z = 2.11) quasar that is visually (in ordinary light) between us and the dense core of a low redshift (z = 0.022) galaxy, NGC 7319, is just dismissed out of hand.
I was under the impression that a host was more than one.

The Keel papers do show that spiral galaxies tend to be optically opaque along the arms and near the nucleus and so this quasar should not be visible. The key word is "tend". We have found optical holes in our own galaxy. It may be that this quasar is visible through such a hole. I am not ruling out that this is a real phenomenon and agree with the authors of the paper that more study is needed.
 
The full posting I "misrepresent" is here and is actually about this topic. The applicable paragraph is:

I was under the impression that a host was more than one.

The Keel papers do show that spiral galaxies tend to be optically opaque along the arms and near the nucleus and so this quasar should not be visible. The key word is "tend". We have found optical holes in our own galaxy. It may be that this quasar is visible through such a hole. I am not ruling out that this is a real phenomenon and agree with the authors of the paper that more study is needed.


You will also notice an outright fabrication by BAC
"David and his friends on this forum like to go on and on about dark matter being directly "observed" in the case of the Bullet Cluster ..." in that this David did not go on about the bullet cluster ( I am not sure I even mentioned the bullet cluster), I did go on about star clusters, one of many unaddressed points.

But you will notice that BAC will just refuse to discuss anything that refutes his arguments and resort to saying that he has and that it is someone else's fault that he can't explain his way out of a wet paper bag.

Such as his response to four long posts about sampling theory, dismissed with a haughty, you are not worth my time to explain my error, when the truth is, he BAC can't refute my examples and so just waves his hand and moves on to his next spam attack.
 
Hi BAC,

I will not be that suprised by whatever lack of respose you give but here are the three posts that do address your and Arp and Burbidges and others bad use of statistics, I am sure you will ignore them just as you do so many things:


But i notce that you are still using the 'rarity of a possibele alignment' to bolster your argument which is addressed here. Why is the possible chance associations you meantion not comparable to the discussion here:
http://www.internationalskeptics.com/forums/showpost.php?p=3595842&postcount=162

And you still haven't addressed representative sampling at all:
http://www.internationalskeptics.com/forums/showpost.php?p=3596372&postcount=163


Nor have you addressed you mistaken use of probability after the fact
http://www.internationalskeptics.com/forums/showpost.php?p=3596661&postcount=165
 
Last edited:
One quick comment,,,

You may beable to pass off one as a mere co-incidence, but, for example, Galaxy NGC 7603 has two definate small quasar like objects clearly at both points in the plasma filament connecting the quasar to the galaxy. Both have very different Redshifts.

Theres a picture of it about twenty seconds into this documentary, with various astronomers talking about it;

http://www.youtube.com/watch?v=EjQVybreSUs

Well you need to address the fact that you haven't shown that it isn't coincidence, addressed here:
http://www.internationalskeptics.com/forums/showpost.php?p=3595842&postcount=162
 
One quick comment,,,

You may beable to pass off one as a mere co-incidence, but, for example, Galaxy NGC 7603 has two definate small quasar like objects clearly at both points in the plasma filament connecting the quasar to the galaxy. Both have very different Redshifts.

Theres a picture of it about twenty seconds into this documentary, with various astronomers talking about it;

http://www.youtube.com/watch?v=EjQVybreSUs
Rather than look at what is probably a one-sided documentary judging by its description I went straight to an applicable paper: The field surrounding NGC 7603: Cosmological or non-cosmological redshifts?

This observation is almost enough to convince me that anomalous redshifts exist and so distances determined from some QSO's are in doubt. I would like an independent observation, preferably at a higher resolution so that any structure of the alleged QSOs can be determined.

IMHO, If this observation is confirmed it will cause as many problems for cosmologies including "intrinsic redshift" as it will for conventional cosmology.
If these 2 quasar-like objects (and NGC 7603B?) were ejected from NGC 7603 in one ejection event then why do the quasar-like objects have different intrinsic redshifts?
If they were ejected in separate events (i.e. have different ages) then why is there an identical direction of ejection?
 
That's not true. I have no problem with baryonic dark matter. I've said that many times.

And it's because certain posters keep mischaracterizing what I actually said that I choose to ignore some of the efforts to debate me on certain threads after basically everything has been said that needs to be said and after I've been repeatedly insulted on those threads. So if I wish to discuss dark matter then I will visit that thread you mentioned. But I would appreciate your confining your remarks on this thread to the matter of redshift and observations that suggest redshift might not equate to distance in all objects. For example, would you like to comment on my calculation regarding the improbability of so many redshifts in quasars near certain galaxies that are close to the Karlsson values? Or do you have something to add regarding NGC 7319 and the quasar that appears to be on this side of it?
.
It may be that your views have been mis-characterised, but I think the record, from your own posts, is pretty clear.

However, as this thread is, supposedly, about your defence of certain Arp et al. papers, with respect to use of statistics, I shall start a separate thread on this topic. For me, that other topic is more interesting anyway ...
 
DeiRenDopa said:
A series of posts on questions that remain unanswered.
In other words, a desperate attempt to obfuscate your growing problelm on this thread? Perhaps we should stick to the calculation I offered until you convince everyone there is no problem? If you can't, perhaps then we can focus on identifying a viable alternate solution. :)
.
I refuse to answer any questions about whether I have stopped beating my significant other or not ... nor will I answer any question about whether I have zero, one, or more significant others.

For what it's worth, there are so many separate sub-threads that I think the time will soon come for a different approach. I hadn't anticipated this one, but it's a good reason why some threads do grow to be so long.

There seem to be just two papers BeAChooser is interested in discussing (those on NGC 3516 and NGC 7319).

Wrangler, I'm no longer sure about.

Dancing David clearly wants to stick to why he started this thread in the first place (and the paper on NGC 3516 would fit nicely within that scope, I think).

And I would like to have the unanswered questions in post 207, 208, and 209 answered.

However, at some point I think we should get onto the question of what a quasar is; if we don't I feel this thread will grow much longer.
 
That's ok. I'm feeling the pressure of tax time too. :D
.
If I may ask, how did you come to conclude that DeiRenDopa is feeling the pressure of tax time?

Or did you intend the "too" to have a general meaning (as in 'so are lots of people, other than BAC')?

Or something else?
 
Galaxies visible to us, through the plane of our own, include the Circinus galaxy, four of the five large galaxies in the Maffei group, and the many found in the various 'zone of avoidance' surveys.

Maybe there should be a separate thread on the transparency of spiral galaxies? Clearly there is some confusion over this.
 
BeAChooser said:
Again, another misrepresentation of what I quite clearly stated. That's why I'm not going to go back and address this issue with you, RC. It makes no difference what I actually say, you will just misrepresent it.
The full posting I "misrepresent" is here and is actually about this topic. The applicable paragraph is:
David and his friends on this forum like to go on and on about dark matter being directly "observed" in the case of the Bullet Cluster ... even though there are a host of gnomes and assumption based calculations implicit in that so-called observation. Yet, the 2003 discovery of a high redshift (z = 2.11) quasar that is visually (in ordinary light) between us and the dense core of a low redshift (z = 0.022) galaxy, NGC 7319, is just dismissed out of hand.

I was under the impression that a host was more than one.

The Keel papers do show that spiral galaxies tend to be optically opaque along the arms and near the nucleus and so this quasar should not be visible. The key word is "tend". We have found optical holes in our own galaxy. It may be that this quasar is visible through such a hole. I am not ruling out that this is a real phenomenon and agree with the authors of the paper that more study is needed.
.
I hadn't read that post, or thread, thanks for the reference.

I thought you were referring to this BAC post, where he says (I added emphasis):
I guess I believe the verdict is out and what makes me uncomfortable with Big Bang is that one phenomena after another is being explained only via bizarre particles, forces, energies and interactions that we haven't been able to demonstrate or see in a lab here on earth. At this point they are purely mathematical constructs.
.

Yet in this thread, and others, there is much ado about an extremely bizzare interaction (or perhaps it's a force or energy?) that no one has been able to demonstrate or see in a lab here on earth ... 'intrinsic redshift'.
 
.
...
Dancing David clearly wants to stick to why he started this thread in the first place (and the paper on NGC 3516 would fit nicely within that scope, I think).

And I would like to have the unanswered questions in post 207, 208, and 209 answered.

However, at some point I think we should get onto the question of what a quasar is; if we don't I feel this thread will grow much longer.

It is okay for the thread to wander, some derailing is inevitable, and I am a big one for it. I just find that it is one of the tactics of BAC and Zeuzzz to jump threads, change topics and avoid discussion of issues.

I think that trying to tackle the issue of what is a QSO and how do we define it, fits right into the thread topic.

the length of the thread is immaterial, i think that aftyer a year of this, i have seen most of what the PC/PU people have to offer on this forum.

The key point is that when you ask them to put the rubber to the road, they disappear.

Like BAC, he won't address the actual statistical issue of sampling.

Now he is dodging into how Bayesian statitics or the Poisson formula are appropriate because of the 'rarity' of the events, which just feeds right into my critique.

there is an assumption of that rarity, there is no demonstration of the rarity, just the wonderland assumption that 'the stuff i want to mean something is meaningful'.

So as usual with The PC/PU posters on the JREF there is just the allsuion of meaning, the vague hints, the possible speculations but when it comes to actual demonstration of the priciples suggested.

Well then there is the thundering silence.

So BAC:

Now we have another unaswered question which will be

1. b. How have you demonstrated the rarity of your alleged ejected QSOs? Which you haven't found any cross eveidence for, are rare? You have to use sampling to do that. So the same hang up as the original question of the thread.

Related question

There should be plenty of other data that would support the ejected QSOs and the mass aquisition other than the anamalous redshifts, where is it? What else would the theory suggest that could be observed. Not just the anamalous red shift and alleged quantization of redshifts, but how about something else? That is not subject to possible sampling error.
 
One quick comment,,,

You may beable to pass off one as a mere co-incidence, but, for example, Galaxy NGC 7603 has two definate small quasar like objects clearly at both points in the plasma filament connecting the quasar to the galaxy. Both have very different Redshifts.

Theres a picture of it about twenty seconds into this documentary, with various astronomers talking about it;

http://www.youtube.com/watch?v=EjQVybreSUs
.
Ah, the hit and run seagull spamster drops another piece of woo! :rolleyes:

May one enquire as to how much of the ElectricUniverse marketing budget you are being paid to spam internet discussion forums such as this one?

Or perhaps you're trying to tell us that you think science (astronomy, cosmology, etc, in this case), if it were done properly, would be conducted entirely by YT video clips?
 
Rather than look at what is probably a one-sided documentary judging by its description I went straight to an applicable paper: The field surrounding NGC 7603: Cosmological or non-cosmological redshifts?

This observation is almost enough to convince me that anomalous redshifts exist and so distances determined from some QSO's are in doubt. I would like an independent observation, preferably at a higher resolution so that any structure of the alleged QSOs can be determined.

IMHO, If this observation is confirmed it will cause as many problems for cosmologies including "intrinsic redshift" as it will for conventional cosmology.
If these 2 quasar-like objects (and NGC 7603B?) were ejected from NGC 7603 in one ejection event then why do the quasar-like objects have different intrinsic redshifts?
If they were ejected in separate events (i.e. have different ages) then why is there an identical direction of ejection?
.

There are a great many other consistency questions that could be asked.

For example, two that I already mentioned, earlier in this thread:

* where are the 'wakes' (such massive objects ploughing through the inter-galactic medium at such high speeds would be expected to leave very bright radio/x-ray/etc wakes)?

* if 'intrinsic redshift' objects are not rare, and if the underlying physical mechanism is variable mass, then how come no 'light' protons (etc) have been observed in the cosmic rays that reach the Earth?

For this particular part of the sky, there's also the question of where the 'transition fossils' are - matter that has a redshift intermediate between that of the putative parent and its various children? This is particularly curious in the case of 'connecting' bridges and filaments ... how come, apparently, not a single atom or molecule has a mass intermediate between parent and child, despite there being a lot of matter that emits and absorbs photons exactly where such transition fossils would be expected to be found?

Finally, the irony of a staunch 'plasma cosmologist' staunchly supporting 'intrinsic redshift' has surely not passed you by, has it? I mean, all that invective heaped upon scientists for using concepts not seen in any earthly lab (dark matter, dark energy, etc), here we have uncritical acceptance, nay advocacy, of a concept equally lacking in anything found in lab experiments! :jaw-dropp
 

Back
Top Bottom