Electric universe theories here.

Status
Not open for further replies.
However, it is now done. I have seen the flares in white light & EUV, and I have seen all the frames.

Sure, but then my next "concern" is how much time and effort you put into analyzing those three consecutive images? Did you notice that the photosphere changes between the image right before the flare image and the flare image? Did you notice which direction the plasma went? I don't really know. I respect you a great deal on many levels Tim, but you'll have to explain to me *WHY* you interpret things differently.

I have seen all of the images you wanted me to see, and all the frames, so far as I know. I disagree with your interpretation of the images.

Then please explain *why* you think that way.

Indeed, I will say that your reliance on the images is your primary weakness.

Whereas I would say your callous disregard for imagery analysis is your primary weakness. I suppose I'll have to wait to hear you explain why you disagree with my interpretation.

It is as I said before, you have to rely on a subjective interpretation of the images to make your point.

How is that different than any other interpretation? You don't "subjectively" apply your math skills?

There is nothing in the images, not in any frame, which is sufficient to differentiate between your hypothesis and that of mainstream physics,

Well, it's not even all together clear exactly what the "mainstream" position is as it relates to the location of the bases of the loops. Nasa's animations make it clear they expect these loops to originate under the photosphere. LMSAL seems certain they start ABOVE the photosphere. Whom shall I believe based on that image Tim?

It is not enough simply to promote an alternative hypothesis. You must provide a means to simultaneously verify your hypothesis and falsify the competition (in this case, the mainstream physics). I see nothing that does this.

I can falsify LMSAL's position with the three images on that video and they are the one's that put that video together. Likewise I can verify the validity of that animation by the folks at NASA based on the three same images.

You have argued strenuously all along that the EUV images show the photosphere,

No, actually I believe the 1600A images are showing us the calcium plasma surface which is located *UNDER* the photosphere IMO, not over top of the photosphere as LMSAL claims. LMSAL has *EVERYTHING* screwed up IMO as it relates to locations of various layers. They have the calcium mixed with helium in the chromosphere, but if you look at CAII images and Helium images during sunspot activity, helium images don't show any sunspots whereas the CA images typically look a lot like the surface of the photosphere, but not *EXACTLY* the same as the photosphere. In other words there is a similar pattern in both the CAII and white light wavelengths that doesn't show up in He wavelengths.

and it has been one of the major points of contention all along. But now you simply brush all of the aside and admit that the EUV images do not show the photosphere?

I admit that they do not show the photosphere. In fact I defy you to quote me where I claimed they show the same part of the solar atmosphere.

If you are going to say that, is there anything left to talk about?

Sure. I think RC's list is over twenty or so questions long now. :)

I though that was the point you were trying to make, it is certainly the point you told me you were trying to make.

No, the point I was trying to make is that the bases of the loops are not located above the photosphere as LMSAL claims, but rather they begin far below the photosphere as that NASA animation suggests.

In any case, that the magnetic loop crosses through the photosphere has never been a point of contention; it is well known that they do, and that the loops extend well below the photosphere.

Explain that to LMSAL. They they have the bases of the loops located in the chromosphere.

The real point of contention is "where does the flare start?"
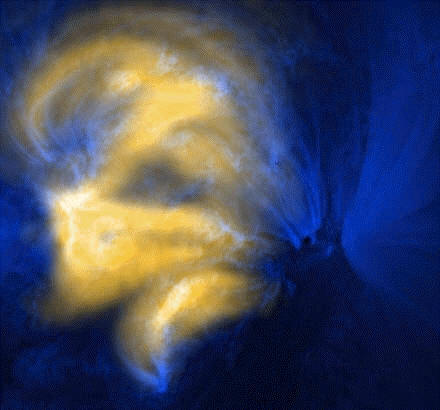
Well, it clearly starts *UNDER* the photosphere because we see the whole set of loops in that image and we can see where those loops cross the surface of the photosphere and light up the photosphere. The bases of the loops *CANNOT* be located above the photosphere.

Is it below, in, or above the photosphere?

It begins (sometimes ends) significantly "below" the photosphere as that Doppler image and the heliosiesmology data demonstrates.

Given only the videos & frames you have specified, all 3 alternatives are clearly possible. We need more information, aside from the images, to make a conclusion.

No way Tim. The only location that is feasible is BELOW the photosphere. The ejection of material from the photosphere demonstrates that point. Pay *CLOSE* attention to the surface of the photosphere in the center of those loops in the image before the flare and of the flare. If you're doing your homework "properly", you'll see physical changes in the surface of the photosphere during the flare process.
 
Last edited:
But what does that mean when the number of modes is infinite, and the amplitudes are varying continuously?

The number of modes is infinite at high energies only, if we've in finite volume - but at high energies the quantization of occupation numbers means the modes aren't occupied at all (just as in the resolution of the UV catastrophe for photons in a hot box). As for amplitudes varying continuously, that's an artifact of the classical approximation. In an exact treatment they don't vary continuously.

One might interpret amplitudes as some sort of probability of having a photon in a mode, but in fact even there, you'd need to do an integral over a range of modes in order to get a nonzero value. But I don't think you can get a single number answer for the total number of photons unless you decide on some sort of average frequency for the photons you're considering.

Your question was how many photons make a 1T magnetic field, right? To answer that we'll need to restrict the field to a finite volume, say 1 cubic meter. Imposing boundary conditions on the edges, the mode spectrum is discrete, so it's a sum rather than an integral. Assuming that sum is dominated by the fundamental mode, I suppose the answer is simply one Tesla squared (energy density) times the volume (meter cubed) divided by the energy of a photon in the fundamental (inverse meter in natural units), which gives about 10^29 photons (ignoring some pis).

Ah, this and the subsequent conversation are aspects of the issue I had not thought of before. Most interesting. But certainly very few people, even very few physicists are likely to automatically think of static fields, or even non-static fields (i.e., waves in a magnetic field or Alfven waves) in terms of photons. I think its use by Mozina needlessly confuses the issue.

Yes, absolutely. It's completely unnecessary. Or more precisely, it's simply a wrong way to think about the problem. It's akin to thinking about tsunamis in terms of dihydrogen monoxide, a topic we've recently tried to explain to him.
 
Last edited:
In other words, your objection is purely semantic. Which is what I said. You are now explicitly acknowledging what you just denied. Quite impressive.

Let's see.

You are now willing to admit that the following terms are all interchangeable terms:

Magnetic reconnection
Particle reconnection
Circuit reconnection

Is that true?

Was that also true three weeks ago?

Why would you intentionally choose a term that is neither consistent with particle physics theory or electrical engineering when you have two "better" terms to choose from?
 
The number of modes is infinite at high energies only, if we've in finite volume

But generally speaking we're not in a finite volume.

Your question was how many photons make a 1T magnetic field, right? To answer that we'll need to restrict the field to a finite volume, say 1 cubic meter. Imposing boundary conditions on the edges, the mode spectrum is discrete, so it's a sum rather than an integral. Assuming that sum is dominated by the fundamental mode, I suppose the answer is simply one Tesla squared (energy density) times the volume (meter cubed) divided by the energy of a photon in the fundamental (inverse meter in natural units), which gives about 10^29 photons (ignoring some pis).

And here we see the problem: in order to get a meaningful number, we had to basically pick a wavelength, but that choice was essentially arbitrary and meaningless. Choose a different wavelength and you'll get a different number. Which is part of why nobody actually treats static fields as being composed of photons: it's a terrible way to approach such a problem, which was what any real effort to answer my question would reveal, as yours did.

Of course, Michael couldn't have done any of this anyways, which was also part of the point of my question. Not that additional proof of his inability to do calculations was necessary.
 
Of course, Michael couldn't have done any of this anyways, which was also part of the point of my question. Not that additional proof of his inability to do calculations was necessary.

And of course everyone knows that the validity of EU theory (or any scientific theory) rises and falls on my personal maths skills......
 
Let's see.

You are now willing to admit that the following terms are all interchangeable terms:

Magnetic reconnection
Particle reconnection
Circuit reconnection

Is that true?

I make no claims about the interchangeability of those terms. I don't need to. All I need to do is recognize what you are claiming. And what you are claiming is not that magnetic reconnection is wrong, but that it is mislabelled. Which is a semantic objection.

Why would you intentionally choose a term that is neither consistent with particle physics theory or electrical engineering when you have two "better" terms to choose from?

It doesn't matter what terminology I would choose. I had no hand in it, and I can't go back in time and change it. The existing terminology is what it is.
 
And of course everyone knows that the validity of EU theory (or any scientific theory) rises and falls on my personal maths skills......

Fortunately for us all, nothing rises or falls on your math skills, except perhaps your own credibility as someone qualified to say anything about physics. But perhaps that counts as part of nothing.
 
Fortunately for us all, nothing rises or falls on your math skills, except perhaps your own credibility as someone qualified to say anything about physics. But perhaps that counts as part of nothing.

The problem of course is that I have already "done math" for DRD (on other forums) and for others in cyberspace. Did I get any credit from anyone for my efforts? What point was there in explaining to you how many photons were required? Did sol's explanation convince you of anything or change your opinions in any way?
 
I make no claims about the interchangeability of those terms. I don't need to.

Yes you do. If you and I are going to communicate effectively, you will have to be able to alternate between Alfven's presentation of "circuits" in plasmas and what you are calling "a magnetic line with current flow inside the line". Since you are *STILL* unwilling to do that, your resistance to agreeing with me demonstrates that this is more than just a problem with semantics. If it was, you would have simply agreed and that would have been that.

All I need to do is recognize what you are claiming. And what you are claiming is not that magnetic reconnection is wrong, but that it is mislabelled. Which is a semantic objection.

It "could be" a semantic objection *IF* you could make the 'jump" from "magnetic lines with particle flow inside the line" and a "circuit". Since you can't do that, I can't communicate with you at all.

It doesn't matter what terminology I would choose. I had no hand in it, and I can't go back in time and change it. The existing terminology is what it is.

A bad term is always going to be a bad term. Why continue to go down a stupid path that is guaranteed to create unnecessary confusion just because you did so in the past?
 
But generally speaking we're not in a finite volume.

So you were not really interested in the answer when you asked the question. All you intended to do from the start was to bitch about the answer when (assuming) you did get an answer and make someone waste their time. I'm glad it was sol and not me.
 
The problem of course is that I have already "done math" for DRD (on other forums) and for others in cyberspace.

I'm not going to chase you to other forums. You have done nothing here. But more damningly, you've done nothing on your own website. Despite the fact that the ideas you promote would be revolutionary if correct, you cannot be bothered, even after YEARS of writing about this stuff, to perform even the most basic calculations of the fundamental properties of your own model. That's just pathetic, really. You've wasted so much of your life, with nothing to show for it.

What point was there in explaining to you how many photons were required? Did sol's explanation convince you of anything or change your opinions in any way?

The exercise of arriving at an answer would have revealed why it's bloody stupid to try to think about static fields in terms of photons. Sol already knew that and decided to give it a go anyways, but I was hoping that you might figure that out yourself. But that hope was in vain: you never have, and probably never will, calculate a single thing on this forum. Nor were you able to learn from someone else doing the calculation for you. But that's par for the course.
 
So you were not really interested in the answer when you asked the question.

Sure I was. But far more than the number, I was interested in your understanding of the question, and how you solved it. Sol's response shows that he understands the problem. But of course, you didn't answer the question, because you couldn't. You keep going on and on about how magnetic fields are made up of photons, but you've got no clue about what that actually means.

All you intended to do from the start was to bitch about the answer

What you quoted was in response to Sol's statement about the number of modes, not the number of photons. Do you understand the difference? Hell, do you even understand why finite versus infinite volumes changes the number of modes? No, I don't suppose you do.
 
Sure I was. But far more than the number, I was interested in your understanding of the question, and how you solved it.

I thought sol's method was pretty clever. I never gave it two seconds of thought however because I knew damn well you weren't actually interested in the answer.

Sol's response shows that he understands the problem.

Evidently he understands it much better than you do too. Sol evidently has many redeeming qualities.

But of course, you didn't answer the question, because you couldn't.

You are confusing the term "could" with "would". If I though it might make the slightest amount of difference to you I might have bothered to put some effort into the idea. Since you won't even download and watch a video, why should I waste my time on you?

You keep going on and on about how magnetic fields are made up of photons, but you've got no clue about what that actually means.

Unlike you, I actually do grasp the physics. Unlike sol, I'm not into doing busy work math. Notice that his answer didn't matter to you one iota? What difference did it make to anyone that you got your answer?

What you quoted was in response to Sol's statement about the number of modes, not the number of photons. Do you understand the difference? Hell, do you even understand why finite versus infinite volumes changes the number of modes? No, I don't suppose you do.

I don't suppose you even care that it doesn't matter on iota that my math skills or lack thereof have no bearing on the issue at all. It don't suppose it matters to you that you have your answer and yet you are still not happy or convinced of anything based upon that answer.
 
I'm not going to chase you to other forums.

I never asked you to. I've just been down this road before.

You have done nothing here.

BS. I provided you with numbers from Birkeland, Bruce and Alfven on several topics and you ignored all of it.

But more damningly, you've done nothing on your own website.

My website? Did you read any of the papers I was involved in?

The exercise of arriving at an answer would have revealed why it's bloody stupid to try to think about static fields in terms of photons.

It is not stupid. In fact at the level of subatomic physics, that is in fact the way QM views it. The carrier particles of the EM field is thought to be the photons. You'll have to blame the folks that wrote QM.

Sol already knew that and decided to give it a go anyways, but I was hoping that you might figure that out yourself.

Ya, and I was hoping you'd actually watch that video and analyze those images too. I guess we're all disappointed eh?

But that hope was in vain: you never have, and probably never will, calculate a single thing on this forum.

Since I answer most of these posts at work between tech calls and programming, that's probably a fair assumption. I do think however that an update of my website is in order and I'll have to think about some of these questions and see if they warrant some effort. I'll be honest, your question about heat flow warrants a response, but I want to focus on those million degree loops and satellite images for the time being.

Nor were you able to learn from someone else doing the calculation for you. But that's par for the course.

Actually, that isn't true. I did enjoy and appreciate sol's solution. It's a pity it was a waste of breath and effort and it had no meaning to either of you whatsoever.
 
Last edited:
But generally speaking we're not in a finite volume.

We're not?

If you want to know how many photons make up a uniform 1T field that fills an infinite universe, the answer is... infinity, and that's what we would find from this treatment. If it's a finite lump of field in an infinite universe, I think we'll still get a finite answer, even though the spectrum is continuous... (...but I'd need to think about that. It should boil down to this giving an integrable probability density for the mode numbers. And you'd have to be careful about how precisely you asked the question - measured with any instrument with finite energy resolution, the number of photons would be finite. Perhaps measured with an instrument with infinite energy resolution, it's not - but then again such an instrument might detect an infinite number of photons even in a vacuum, and it's physically impossible to build one in any case.)

And here we see the problem: in order to get a meaningful number, we had to basically pick a wavelength, but that choice was essentially arbitrary and meaningless.

I don't think it's arbitrary. I believe my answer is approximately correct for the problem as I stated it - a 1T field confined to a meter cubed of volume, with zero field outside. To get the precise answer for that configuration, one simply needs to do that sum more carefully - which will yield a finite answer, perhaps given some reasonable prescription concerning the high frequencies (and in any case a problem there could only arise if the edges of the field are infinitely sharp, which of course they can't be in a physical configuration). If you gave me a different field configuration, I'd get a different answer, of course - but the procedure is well-defined as far as I can see.

Of course, Michael couldn't have done any of this anyways, which was also part of the point of my question. Not that additional proof of his inability to do calculations was necessary.

Absolutely. But we shouldn't let someone's ignorance, laziness, and stupidity stand in the way of an interesting discussion.
 
Last edited:
I don't suppose you even care that it doesn't matter on iota that my math skills or lack thereof have no bearing on the issue at all. It don't suppose it matters to you that you have your answer and yet you are still not happy or convinced of anything based upon that answer.

You don't understand the answer, Michael. And it's the understanding of the answer which is important.

And frankly, I don't care much that you didn't answer this question. You have far more glaring failures to contend with. And it's not even a matter of you being unwilling to answer my questions: you are unwilling to quantify any of your own ideas, even on your own website. There could be people out there who might believe you, but want to see the actual quantitative predictions that flow from your ideas. Since folks like sol and me are obviously just brainwashed by the giant physics conspiracy, who's going to give them the real numbers, Michael? Since you've spent so much time and effort developing your theory, and your website, why can't you actually follow through and quantify anything?

It's really just sad that you never have.
 
We're not?

No, generally we're not.

If you want to know how many photons make up a 1T field that fills an infinite universe, the answer is... infinity, and that's what we would find from this treatment.

Yes, we would. But I had in mind a more physically realistic scenario, such as a 1 Tesla field in one location which dies off as we move away. In such a physically realistic field configuration, we have no boundaries, and there are no discrete modes.

I don't think it's at all arbitrary. I believe my answer is approximately correct for the problem as I stated it

It's not an arbitrary answer for the way you stated the question. But the way you stated it is arbitrary, because there's no reason you needed to pick a 1 m3 volume given how the question was originally posed. Which was part of my point: the statement that a magnetic field is "made up" of photons suggests something about the decomposition of a field into individual photons which just isn't so. You and I know it isn't, but I really don't think Michael does. I think his understanding is shallow enough to think that X number of photons means Y field strength, and that's all there is to it. It was perhaps foolish of me to think that he could be educated on the issue by considering this problem, though.
 
BS. I provided you with numbers from Birkeland, Bruce and Alfven on several topics and you ignored all of it.

No you didn't. You posted links to papers of theirs. Not the same thing. Furthermore, none of their papers address YOUR claims about the solid surface of the sun, or cathode refrigeration.

My website? Did you read any of the papers I was involved in?

Yes. And nowhere do the papers talk at all about your solid shell, or cathode refrigeration. Those are YOUR ideas. If correct, they would be revolutionary. So why don't you quantify your ideas to see if they make any sense whatsoever?
 
Yes, we would. But I had in mind a more physically realistic scenario, such as a 1 Tesla field in one location which dies off as we move away. In such a physically realistic field configuration, we have no boundaries, and there are no discrete modes.

Right. Perhaps you missed the part of my post where I addressed that? (I edited it shortly after posting; you might not have seen it).

I don't think an infinite universe/continuous spectrum changes anything, although I acknowledge my argument is no longer so transparent in that case. But it's still true the FT is dominated by modes with wavelength around a meter. It's just that the question - how many photons are there - becomes ill-defined in the sense that one may need to specify how the measurement is being made. If it's made with an instrument with an energy resolution around an inverse meter, I think the answer is more or less exactly as I said. If it's made with an instrument with a much finer energy resolution, I think the answer is still as I said, although I agree it's less obvious.

It's a baby version of the the kind of IR divergences that arise in QCD if you're not careful how you define jets. And I think the answer is similar - any finite energy resolution will give essentially the same answer for the total number of photons, because the number of photons in each bin will fall as the number of bins increases (since the FT of the B-field should be interpreted as a probability density for the occupation number, and the integral of the density is finite and independent of the energy resolution).

But perhaps there are some weakly divergent terms... I'd have to do a calculation to be sure. What do you think?
 
Last edited:
The problem of course is that I have already "done math" for DRD (on other forums) and for others in cyberspace. Did I get any credit from anyone for my efforts? What point was there in explaining to you how many photons were required? Did sol's explanation convince you of anything or change your opinions in any way?
[/lurk]
That was one question.

Excuse me MM, you said that the allegedly solid layer of iron in the sun is cooled by the electrons coming off of the iron surface, or that the quantity of electrons is so high they carry away the heat radiation. How many electrons would that take?
[/lurk]
 
(Again I predict not a single finger will be lifted to offer objective evidence supporting the half baked surface of the Sun crap. Ignorance, lying, and/or bitching will follow. Woohoo! I've been right every time so far with these predictions. Can I apply for the JREF million, or is this too easy? :D)


Looks like Michael has chosen to be ignorant this time. And I'm still batting a thousand! :)

Hey, Michael, when are you going to take that LMSAL running difference graph down from your web site? It doesn't in any way support your crazy claim that the Sun has a solid surface. Everyone knows it. I think even you do, but your pride is stopping you from admitting it. Come on, kid, just remove it nice and quietly, no fanfare, no announcement. Probably go unnoticed by virtually every scientist in the world because, really, none of them even care about that looks-like-a-bunny, true-because-I-say-so pretend science stuff you crackpots dabble in anyway. :)

And I'd be one of the only people taunting you about it, Michael, reminding you that you were so wrong for such a long time, and how you looked so foolish by letting your silly pride overtake your sense of reason. And then you could put me down with a snappy retort like, "I'm a scientist, and as a scientist I can readily admit when I'm wrong about something. And I took the graphic down because I was wrong about it. It doesn't show anything like a solid surface. It can't. The data used to make that graph was obtained many thousands of kilometers away from the place where I was claiming there was a surface."

Then you'd get a bunch of high-fives from people who actually understand this stuff that you don't understand. And you'd have one less thing to be constantly lying about. Imagine how much of a burden that alone would eliminate.

And then we could move on to that ridiculous claim you make about the next running difference graph, the SOHO one. That's the one that, if it was actually showing surface features, mountains, valleys, etc., they'd have to be dozens of thousands of kilometers high and deep to create that kind of texture. And there would have to be light sources way out beyond the Sun itself lighting those features to create those highlights and shadows. No sane person would believe it!

We'd all have a good laugh at your expense, again, as we do now with your ignorant assessment of the LMSAL graphic. Then we'd shred that second one even more easily than we shredded the first one. You'd beg and plead and throw tantrums and lie about it for a few years, then you'd eventually admit you're wrong and take that one off your web site, too. And you'd get the pleasure of acting like a real scientist for perhaps only the second time in your life, and admitting you were wrong again!

Good stuff for your future, Michael. See how cool that would be? :D
 
Last edited:
I don't think an infinite universe/continuous spectrum changes anything, although I acknowledge my argument is no longer so transparent in that case. But it's still true the FT is dominated by modes with wavelength around a meter.

The FT should be dominates by modes with wavelengths about the characteristic size of our high-field area. This could be on the meter scale, but it most definitely doesn't need to be.

It's just that the question - how many photons are there - becomes ill-defined in the sense that one may need to specify how the measurement is being made. If it's made with an instrument with an energy resolution around an inverse meter, I think the answer is more or less exactly as I said. If it's made with an instrument with a much finer energy resolution, I think the answer is still as I said, although I agree it's less obvious.

This answer makes little sense to me. I know of no way to directly measure the number of photons that make up a static magnetic field. The only way to obtain this number that I can think of is to measure the field strength over an area and take the Fourier transform of it - sticking any kind of photodetector in a static field will do nothing. And in the FT analysis, the answer will depend upon the size of the field. Any energy sensitivity will only arise from spatial sensitivity (ie, you need to resolve the size of the field).
 
The FT should be dominates by modes with wavelengths about the characteristic size of our high-field area. This could be on the meter scale, but it most definitely doesn't need to be.

Of course - I was taking a meter-scale field (in infinite volume) for definiteness.

This answer makes little sense to me. I know of no way to directly measure the number of photons that make up a static magnetic field. The only way to obtain this number that I can think of is to measure the field strength over an area and take the Fourier transform of it - sticking any kind of photodetector in a static field will do nothing.

A photodetector measures something even in a vacuum, so it certainly will measure something in a non-zero field. And I'm quite sure it will measure more photons near a peak in the FT.

And in the FT analysis, the answer will depend upon the size of the field.

Of course it will - if it didn't, this wouldn't make any sense. But I don't understand why you keep bringing that up - that dependence (plus the field strength) is the whole point.

Any energy sensitivity will only arise from spatial sensitivity (ie, you need to resolve the size of the field).

Again, I'm not sure we're on the same page. If it only depended on the size and not on the boundary conditions, my first answer was correct and we're done. I thought you were worried that it might also depend on the size of the space the localized field lives in. I'm arguing it doesn't depend on that either, but now I'm not sure that's what you were after.

If you accept it doesn't depend on that, we're done - my original example suffices. The 1m is simply illustrative - the answer in general would be 1 Tesla squared times the size scale of the field to the fourth power.
 
http://homepages.ihug.co.nz/~fiski/sundry/15 April 2001 WL.gif
VERY COOL! Just out of curiosity, how did you capture the image, and what DVD playing software did you use? I'd like to be able to capture a number of images, particularly the image directly before and directly after that image so we can discuss all three images at once and look at the changes between the three images.
Most PC's ahave a Print Screen button. Press that. Open your image eitor (I use PSP) and paste.

I am not sure what relevence this image has for your Iron Sun idea. We seem to agree that it looks like a standard magnetic flux tube of a coronal loop. It seem to have emerged from the photosphere just like all the other coronal loops. The only oddity is that it has a very fast velocity since you say that the event only covers 3 frames (a few seconds).

Perhaps you are under the impression that the photoshere cannot be seen into at all? That would explain why you are surprised to see that there are signs of the coronal loop emerging before that frame.
The articles that you have read on optical depth and limb darkening in your textbooks will tell you differently. The posts in this thread will tell you differently.

ETA:
You have known this since at least 8 July 2009:
The mention of limb darkening raises a question for a real astronomer in this thread:

What happens to limb darkening if the density of the Sun has a higher density (of solid iron) at ~0.99Ro (~4800 km below the photosphere) and at the same point the Sun has a temperature that is < 2000 K that then increases to ~6000 K at the Sun's visible surface.

My guess is that there would be a ring seen on the Sun's limb, i.e. instead of the smooth change in intensity that we see and measure, there will be a discontinuity in the intensity.

ETA:
More reading suggests that this is limited to the first 500 km of the photosphere. It also shows that the temperature at that depth in the photosphere is 6400 K as opposed to 5777 K at the top. This may be a problem for MM's solid iron surface.
(emphasis added)
 
Last edited:
And that is exactly what we would expect to observe if the loops come up through the photosphere. The loops light up the photosphere due to the increased electrical activity inside those loops.
It is more exact to say that the plasma that coronal loop emits light that we see through the photosphere as expected.

What? You don't see those bright loops?
I see a bright hoop that looks like a coronal loop. It is not a flare

How about posting the image directly before that one so we can all see the changes that occur in the photosphere as a result of the emerging flare?
How about you doing some work instead?
In fact the question really is - why did you not do this work years ago?

It would be nice to see an interesting example of standard solar physics in action.
 
For the record RC....

Now that you have actually located the frame in question, who turned out to be a more reliable observer of these images, me, Tim or tusenfem? Hell, they couldn't even find the frame that you evidently found pretty easily once you finally downloaded the DVD.
tusenfem could not find it due to your vague instructions. As you state on the 29th July 2009:
I listed) are rough estimates relative to the DVD player. In retrospect it would probably have been better for me to provide the specific LMSAL timestamp on each of the images in question. It should not have been something I had to nail down to a specific image however if he was being the least bit attentive to detail. It's pretty darn obvious when the flare occurs and it does occur during that segment.
Hopefully he will look again

Tim found it.
You called it a flare when it is actually a loop.
I would say that Tim was the more reliable observer of these images.
 
Well, it's not even all together clear exactly what the "mainstream" position is as it relates to the location of the bases of the loops. Nasa's animations make it clear they expect these loops to originate under the photosphere. LMSAL seems certain they start ABOVE the photosphere. Whom shall I believe based on that image Tim?
I can answer this.
The "mainstream" position is that the locations of the bases of the loops in the images depends on the wavelength of light images and is never the position of the "base" of the loop - loops do not have bases.

NASA animations make it clear they expect these loops to originate under the photosphere. This states nothing about the "bases" of the loop. Loops do not have bases.


The "LMSAL seems certain they start ABOVE the photosphere" statement is wrong
  1. LMSAL are certain that coronal loops never start above the photosphere. They are loops. The visual portion is matched by the other haplf of the loop,
  2. The rest is your misunderstanding of astronomical terms.
  • The base of a feature in an image is the lowest portion of that feature seen in the wavelength of the light making the image.
  • The footprint of a coronal loop is its effect on the photosphere. This includes light from plasma below the photosphere that the loop has heated up (AFAIK).
    Occasionally astronomers use this instead of base (bad, bad astronomers :)!)
Thus LMSAL are correct when that say that the TRACE 171A images that show coronal loops with their base ABOVE the photosphere. They are less correct if they use "footprint" rather than "base".
LMSAL should be using "footprints" about the white light images
 
Last edited:
These are some of the questions that MM has been asked and seems incapable of answering other than by spouting unsupported assertions.

  1. What is the amount of 171A light emitted by the photosphere and can it be detected?
    First asked 6th July 2009
  2. A post that seemed to retract his "mountain ranges" on the TRACE 171A RD animation evoked this question:
    What discharge rates and processes come from your hypothetical thermodynamically impossible solid iron surface to show up as records of change in the RD animation in the corona.
    First asked 6th July 2009
  3. From tusenfem:
    Where is the the solar wind and the appropriate math in Birkelands book?
    First asked 7th July 2009
  4. Please cite where in his book Birkeland identified fission as the "original current source" and in the same post
  5. Please cite where in his book Birkeland identified a discharge process between the Sun's surface and the heliosphere (about 10 billion kilometers from the Sun).
    First asked 7th July 2009
  6. Is your solid iron surface thermodynamically possible?
    First asked 8 July 2009
    See this post for a fuller explanation of the thermodynamic problems with MM's solid iron surface.
  7. Coronal loops are electrical discharges?
    First asked 10 July 2009
  8. Can Micheal Mozina answer a simple RD animation question?
    First asked 10 July 2009
  9. More questions for Michael Mozina about the photosphere optical depth
    First asked 13 July 2009
  10. Formation of the iron surface
    First asked 13 July 2009
  11. How much is "mostly neon" MM?
    First asked 13 July 2009
  12. Just how useless is the Iron Sun model?
    First asked 13 July 2009
  13. Coronal loop heating question for Michael Mozina
    First asked 13 July 2009
  14. Coronal loop stability question for Michael Mozina
    First asked 13 July 2009
    He does link to his copy of Alfvén and Carlqvist's 1966 paper (Currents in the Solar Atmosphere and A theory of Solar Flares). This does not model what we now know a real solar flare acts like.
  15. Has the hollow Iron Sun been tested?
    First asked 14 July 2009
  16. Is Saturn the Sun?
    First asked 14 July 2009
    (Birkelands Fig 247a is an analogy for Saturn's rings but MM compares it to to the Sun).
  17. Question about "streams of electrons" for Micheal Mozina
    First asked 14 July 2009
    MM has one reply in which is mistakenly thinks that this question is about coronal loops.
  18. What is the temperature above the iron crust in the Iron Sun model?
    First asked 17 July 2009
  19. What part of the Sun emits a nearly black body spectrum with an effective temperature of 5777 K?
    (MM states that it is not the photosphere)
    First asked 18 July 2009
  20. Is the iron surface is kept cooler than the photosphere by heated particles?
    First asked 18 July 2009
  21. How does the "mostly neon" surface emit white light?
    First asked 19 July 2009
  22. Same event in different passbands = surface of the Sun moves?
    First asked 22 July 2009
  23. Evidence for the existence of "dark" electrons
    First asked 28 July 2008
    Seems to think that 3 pixel differences (full Sun image) or 10's of pixels (limb image) are not detectable. Astronomers would disagree.
  24. MHD also treats plasmas as particles and circuits according to Alfven
    First asked 29 July 2009
    Can you give a citation to where Alfven states that he derives the equations of MHD from collections of particles rather than a fluid?
  25. Why neon for your "mostly neon" photosphere?
    First asked 30 July 2009
  26. Where is the "mostly fluorine" layer?
    First asked 30 July 2009
  27. What is your physical evidence for "mostly Li/Be/B/C/N/O" layers?
    First asked 30 July 2009
  28. What is your physical evidence for the "mostly deuterium" layer?
    First asked 30 July 2009
Actual Answers From Michael Mozina::dl::dl:
Unsupported Assertions as Answers from Michal Mozina:
  1. How are these items of evidence for dark matter incorrect?
    First asked 23rd June 2009
    So far just an unsupported assertion that astronomers have got the visible masses of galaxies wrong (and another reply with his usual "if we cannot detect it on Earth then it does not exist" non-science).
    Now he is on about dark electrons (see above) as an example of matter that cannot be detected!
  2. Why do the composition of the "mostly neon" photoshere and the corona differ?
    First asked 22nd July 2009
    It is "mass separation" - no actual physics cited or experiments. No understanding of the consequences - see the latest questions.
 
Last edited:
A photodetector measures something even in a vacuum,

Only thermal radiation, unless you've got some other light source.

so it certainly will measure something in a non-zero field.

I don't see how it could. What kind of photodetector would you use?

Of course it will - if it didn't, this wouldn't make any sense. But I don't understand why you keep bringing that up

Because a photodetector won't be sensitive to the size of the field. But the number of photons does depend on that (a larger field size means more photons).
 
tusenfem could not find it due to your vague instructions. As you state on the 29th July 2009:

Ya, I evidently gave you folks too much credit the first time. I didn't think you would need me to hold your hand every step of the way. I also pointed out the exact frame and timestamp for both of them and *STILL* they could not find it. Why?

Hopefully he will look again

Hopefully you will also all look again that image that precedes that image too, particularly the area under the emerging loops.

Tim found it.

Ya, but only *after* claiming there were no white light images on the whole DVD and only *AFTER* you accused me of being incompetent for seeing something that wasn't there.

ETA:
Rather than trusting your dubious citations I went to the TRACE web site. The files that make up the DVD are listed in folders under http://trace.lmsal.com/POD/bigmovies/
And the only files I can find for April 15th, 2001 are:
http://trace.lmsal.com/POD/bigmovies...urgeN0_Cap.mov
http://trace.lmsal.com/POD/bigmovies...urgeWO_Cap.mov

Guess what MM? T171 = the TRACE 171A pass band, i.e. activity in the corona not the photosphere. Most of the DVD files are for the 171A or 195A pass bands.

That image wasn't in the 171A pass band now was it?

This was really my favorite line though from that post:

But it looks like you are just incompetent rather then lying about the movie.
There is a list of movies that includes:
Quote:
Movie 32 (description): X14.4 flare in AR9514, 15 April 2001, in 171Å.
Movie 33 (description): X14.4 flare in AR9514, 15 April 2001, in 1600Å.
The second movie is not in "white light" but does include plasma emitting light at the termperature of the photosphere. There is however no frame timestamped "April 15th, 2001, 13:55:01".
It is obvious that you are looking at the first movie (TRACE 171A pass band, i.e. activity in the corona not the photosphere) which does havve a frame timestamped at "April 15th, 2001, 13:55:01".

You folks were the ones that turned out to be incompetent downloaders and incompetent observers, not me. For the record nobody lied to you, not even Tim when he said they all looked like EUV images. He was simply wrong and so were you. That didn't stop you from personally attacking me as an individual and accusing me of incompetence. Even the very term "lying" was meant to be a personal "put down". How about having a "fair" debate for a change, one that focuses only on the scientific issues? How about admitting that you blew it for not even bothering to get off you lazy butt and download the images *BEFORE* accusing me of incompetence or lying to you?

You called it a flare when it is actually a loop.

It is a flare event as you can readily see in the various wavelengths were you to actually watch them in their entirety.

I would say that Tim was the more reliable observer of these images.

I would say that is an absolutely *PITIFUL* rationalization. Even you were a better "observer" than either of them after I finally shamed you into downloading the video. Your incompetence was due to your strong tendency to argue your points from a place of pure ignorance. You never even bothered to look for yourself before *ASSUMING* something about me that was not true.

FYI the print screen feature doesn't work with my DVD player software. What program are you using to run the DVD? I'd like to capture the image right before and after the image you posted so that we can look at the region of the photosphere directly under the loops both before the event, during the event, and after the event.
 
Last edited:
It is more exact to say that the plasma that coronal loop emits light that we see through the photosphere as expected.

As WHO expected?

I see a bright hoop that looks like a coronal loop. It is not a flare

It is a bunch of coronal loops, and that's what caused the flare and blew material off the photosphere.

How about you doing some work instead?

I've been doing more than my share. At least I look at, read and respond to the material you folks cite.

In fact the question really is - why did you not do this work years ago?

You and Zig seem to be under the false impression that I've had all of this all figured out for many years. That is simply untrue. I wasn't even aware of this particular image "years ago".

It would be nice to see an interesting example of standard solar physics in action.

Checkout Birkeland's work.
 
[/lurk]
That was one question.

Excuse me MM, you said that the allegedly solid layer of iron in the sun is cooled by the electrons coming off of the iron surface, or that the quantity of electrons is so high they carry away the heat radiation. How many electrons would that take?
[/lurk]

For the record, it's not only electrons that carry heat away from the surface it's protons too.

The only way to scientifically answer Zig's question would be to construct a series of concentric mass separated plasma layers and introduce the notion of "thermoclines" inside the various plasma layers. The plasma double layers would have to be arranged with the hottest and lightest plasma layers on top of cooler more dense plasma layers as we approach the surface.

The total energy output of the sun would have to be equal to the current solar estimates for energy output, however in this solar model, the majority of the light from plasma layers comes from the "current flow" through the double layer, not necessarily because it radiates at a specific temperature. The only requirement is that that total energy output is the same as standard theory but any other variations from standard theory are acceptable in this model.

You'll also note that Zig's fixation on the temperature of the photosphere fails to correctly predict a 20,000 degree chromosphere, or a million degree corona, so if we are going to be "fair" to all models, neither the standard solar model or the Birkeland solar model currently passes his "test" as it relates to the flow of energy and heat distribution. For some reason he gives standard theory a free pass. What's that double standard all about?
 
Again, I'm not sure we're on the same page. If it only depended on the size and not on the boundary conditions, my first answer was correct and we're done. I thought you were worried that it might also depend on the size of the space the localized field lives in. I'm arguing it doesn't depend on that either, but now I'm not sure that's what you were after.

If you accept it doesn't depend on that, we're done - my original example suffices. The 1m is simply illustrative - the answer in general would be 1 Tesla squared times the size scale of the field to the fourth power.

FYI, I appreciate your efforts sol and your solution even if Zig does not. I realize you answered this question for his benefit, not mine, but that effort was motivated by pure scientific interest and that is a noble cause. It's too bad Zig wasn't actually interested in the answer because it was a creative (and accurate) solution to his question.
 
You don't understand the answer, Michael. And it's the understanding of the answer which is important.

Actually, I found his answer to be quite elegant. I seem to be having no trouble at all accepting his answer whereas you are the one that seems to be refusing to "understand" it, or are incapable of understanding it:

This answer makes little sense to me.
 
My Interpretation of the Images

Whereas I would say your callous disregard for imagery analysis is your primary weakness.
I analyze images for a living (at least I did before I retired), and I am well aware of how to do it. You, however, are not. if you think that what we are doing is "image analysis", you're crazy. There is a really big difference between "looking at" and "analyzing" an image. You/We are looking at, but not analyzing, the image.

I suppose I'll have to wait to hear you explain why you disagree with my interpretation.
Both bright features, especially the one above the loop, look to me like they are suspended above the sunspots. I don't see any reason to believe that they extend below the photosphere. The loop is obviously suspended above the sunspot, and does not even look like it touches the surface at all, though the imagery is not really clear enough to tell.

As for the photosphere around the sunspots, it looks like some of the high contrast features are brighter in the flare image than they are before or after. That could be a real physical effect, or it could be the result of a change in the gain of the instrument as a response to the bright flare (the change in brightness is visible but small). Without knowing more about the instrument, I can't tell.

It would be nice to have higher time resolution data to see which comes first, the flare of the brighter features. As it is, the pre-flare frame precedes the flare by 19 minutes, and the post flare image follows over 29 minutes later. The entire event sits in just one frame, so it is quite impossible to know how the events are ordered in time. Certainly the time order is crucial to understanding the details of the physics involved. This would certainly shed "light" on the changes in the photosphere, if they are physically real changes (do they come before or after the flare?)

The problem is that this is not an objective "analysis", but rather a purely subjective interpretation of what the image "looks like". Furthermore, you are trying to lay claim to a physical process ordered in time, from a single snapshot image. We have no image data, just pictures. Is the brightening of the photosphere real, and /or significant? If we had real image data, we could ratio or difference the images and see at once. If we knew how or if the gain of the instrument changes from frame to frame we would know a lot more. If we had higher time cadence data we could actually see the timeline of events. Real image analysis requires real data and real data processing. There was a time in history when looking at an image was all that one could do. But those days are long gone. If you are seriously trying to seriously advance a serious scientific alternative to standard physics, then you have to act serious; stop playing with pictures and start really analyzing images. The "callous disregard for imagery analysis" here is all yours, along with a callous disregard for science and physics.

I have already spent more time on this today than it's worth. Other things call.
 
This bears repeating...

if you think that what we are doing is "image analysis", you're crazy.


... but Michael won't touch actual analysis. The total extent of his ability to analyze amounts to, "It looks like a bunny," and, "It's true because I say so."

Michael, if you were right, some legitimate scientist somewhere would agree with you. None do. You're wrong.

And when are you going to remove that LMSAL running difference graph from your web site so we can start working on that next one?
 
For the record, it's not only electrons that carry heat away from the surface it's protons too.

I included those when I did my calculation.

The total energy output of the sun would have to be equal to the current solar estimates for energy output, however in this solar model, the majority of the light from plasma layers comes from the "current flow" through the double layer, not necessarily because it radiates at a specific temperature.

"Current flow" doesn't generate light, Michael. It can trigger other mechanisms which do, but current itself doesn't. So what current-triggered light emitting mechanisms emit blackbody spectra? Why, heating does.

The only requirement is that that total energy output is the same as standard theory but any other variations from standard theory are acceptable in this model.

You also need the interior to not heat up. Which you can't accomplish.

You'll also note that Zig's fixation on the temperature of the photosphere fails to correctly predict a 20,000 degree chromosphere

No, Michael. We've been over this before. The chromosphere is transparent to the vast majority of light being emitted from whatever is under it. Whatever is under it is therefore thermally coupled to deep space, and can radiate away far more heat than it recieves from the chromosphere. The same is NOT true for anything underneath the 6000 K layer.

so if we are going to be "fair" to all models, neither the standard solar model or the Birkeland solar model currently passes his "test" as it relates to the flow of energy and heat distribution. For some reason he gives standard theory a free pass. What's that double standard all about?

The chromosphere and corona are transparent. The 6000 K layer is not. No double standard at all, Michael, just a recognition of a rather fundamental difference, a difference which we can observe, and which has significant consequences.
 
I analyze images for a living (at least I did before I retired), and I am well aware of how to do it. You, however, are not. if you think that what we are doing is "image analysis", you're crazy.

How can we "analyze" anything if you can't find the image Tim?

Both bright features, especially the one above the loop, look to me like they are suspended above the sunspots.

Well, clearly some of the loop is located above the sunspot and photosphere. The fact the photosphere is brightly lit up at the point where the loops come though suggests that the loops traverse the surface of the photosphere too. Why else is the photosphere lit up like that with a pattern that relates to the sunspot features in the photosphere?

I don't see any reason to believe that they extend below the photosphere.

Why is the photosphere itself "lit up" like that? Did you look at the image before this image and look at the area under the loops, at the surface of the photosphere? Did you notice any changes between the frames?

The loop is obviously suspended above the sunspot, and does not even look like it touches the surface at all, though the imagery is not really clear enough to tell.

Well, if the loops traverse the surface of the photosphere that would certainly explain why the photosphere is brightly lit up on both sides of the loops.

As for the photosphere around the sunspots, it looks like some of the high contrast features are brighter in the flare image than they are before or after.

There are two primary features I expect you to observe in that image. First there is a "ribbon" of light visible in that image that precedes the actual flare image. Prior to these two images, the photosphere in that area looks "normal". Only in two frames does the photosphere "light up" and it's not in the same pattern. Why?

Secondly the photosphere material under the loops is visually "different" under the loops between the previous frame and this image. That is consistent with the idea of a the coronal loops blowing this material up and away from the surface in that area.

It would be nice to have higher time resolution data to see which comes first, the flare of the brighter features. As it is, the pre-flare frame precedes the flare by 19 minutes,

Even 19 minutes earlier we can see changes occurring in the light patterns of the photosphere.

and the post flare image follows over 29 minutes later.

So the whole show is over in less than an hour and we have three frames to work with, four if you count the frame precedes the preflare image. Every detail counts.

The entire event sits in just one frame,

Well, actually it's two frames. There is a change in the photosphere in the preflare frame that is not visible in the previous image. Something is happening even in the preflare frame that is "different' from previous frames.

so it is quite impossible to know how the events are ordered in time.

Well, the image we have or ordered in time and whatever physical model we come up with should fit these observations.

The problem is that this is not an objective "analysis", but rather a purely subjective interpretation of what the image "looks like".

Not completely. It's no longer "subjective" as to whether or not loops are visible in WL images. That wasn't true last week, but this week at least, we all seem to see the loops in white light. The "look like" coronal loops to me, do they look like coronal loops to you? Some things we can already agree upon.

Furthermore, you are trying to lay claim to a physical process ordered in time, from a single snapshot image.

No, I'm trying to point out that the white lit up regions around the loops where they reach the photosphere suggests that the loops are "lit up" far below the photosphere. I'm not actually doing any of this from a "single" image, but rather at least three images, and actually the image prior to the preflare image. It's also based upon watching what happens in this even on *ALL THE OTHER WAVELENGTHS*. I've actually sat through the whole video at least twice in the past week, and I doubt any of you have actually see the whole DVD even once.

We have no image data, just pictures.

We can get all the "image data" we need, but there are physical things that can be observed in "just pictures". A 'picture" can show us a lightening bolt too.

Is the brightening of the photosphere real, and /or significant?

Yes and yes. It is real because the loops traverse the photosphere and there is additional current flowing through these regions than other areas of the photosphere. It is significant because it demonstrates that the loops originate (and could therefore be visible) far *below* the photosphere.

If we had real image data, we could ratio or difference the images and see at once. If we knew how or if the gain of the instrument changes from frame to frame we would know a lot more. If we had higher time cadence data we could actually see the timeline of events. Real image analysis requires real data and real data processing. There was a time in history when looking at an image was all that one could do. But those days are long gone. If you are seriously trying to seriously advance a serious scientific alternative to standard physics, then you have to act serious; stop playing with pictures and start really analyzing images. The "callous disregard for imagery analysis" here is all yours, along with a callous disregard for science and physics.

You know Tim, none of that grandstanding sounds particularly impressive coming from you after you were so sloppy in your original "analysis' that you had no clue that there were even any white light images on the whole DVD. I think you better come down off that soapbox and also start 'acting serious' if you expect to really analyze these images.

I have already spent more time on this today than it's worth. Other things call.

I hear you on that point.

FYI, I see that I missed one of your earlier responses to my questions about Kosovichev's Doppler video. I have several comments to make about that post, but it will have to wait.
 
Michael, if you were right, some legitimate scientist somewhere would agree with you. None do. You're wrong.

As it relates to solar atmospheric discharges, *MANY* scientists agree with me, including Birkeland, Bruce and Alfven. I'm sure there are many others too.

And when are you going to remove that LMSAL running difference graph from your web site so we can start working on that next one?

Graph? What graph? :)
 
I included those when I did my calculation.

Did you include themoclines in ever more dense and cool plasma layers? Did you look at the heat emissions as being a "combination" of all the emissions from all the atmospheric layers?

"Current flow" doesn't generate light, Michael. It can trigger other mechanisms which do, but current itself doesn't.

If we run current through many ordinary materials like ordinary metals and neon like we find in a neon bulb, we get white light. The emissions of the neon bulb, in other words it's white light 'color' is not necessarily indicative of it's physical temperature.

So what current-triggered light emitting mechanisms emit blackbody spectra?

You mean besides that xenon arc lamp we talked about earlier?

You also need the interior to not heat up. Which you can't accomplish.

This is like insisting that because the air temperature above the ocean is 89 degrees that the temperature at the bottom of the ocean can't reach 33 degrees. Thermoclines form and all sorts of strange things happen once we get below the surface. Why is the top of the chromosphere cooler at bottom than where it meets up with the corona?

No, Michael. We've been over this before. The chromosphere is transparent to the vast majority of light being emitted from whatever is under it.

So if the loops originate under it, we should have not problem seeing through it, right?

Whatever is under it is therefore thermally coupled to deep space,

So how do you know that more dense layers under the photosphere aren't also "coupled to deep space again"?

The same is NOT true for anything underneath the 6000 K layer.

You just *ASSUME* this to be the case. You also "assume" that the color of that layer indicates it actual temperature rather than the average temperature of all the particles leaving the surface.

The chromosphere and corona are transparent. The 6000 K layer is not.

Then this composite images shows us what is underneath the photosphere.

mossyohkoh.jpg


But I suppose you'll want to have your cake and eat it too, right?
 
Status
Not open for further replies.

Back
Top Bottom