Moderated Iron sun with Aether batteries...

Status
Not open for further replies.
These are some of the questions that MM has been asked about his Iron Sun idea and seems incapable of answering other than by unsupported assertions.

  1. What is the amount of 171A light emitted by the photosphere and can it be detected? First asked 6th July 2009
  2. A post that seemed to retract his "mountain ranges" on the TRACE 171A RD animation evoked this question:
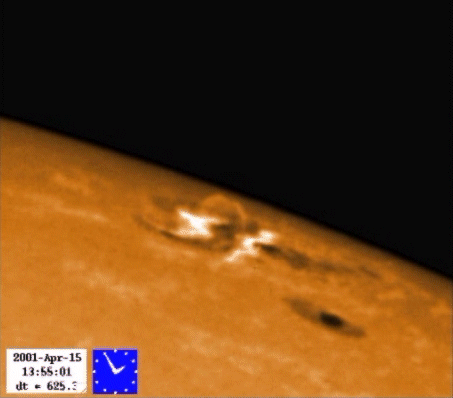
    What discharge rates and processes come from your hypothetical thermodynamically impossible solid iron surface to show up as records of change in the RD animation in the corona. First asked 6th July 2009
  3. From tusenfem:
    Where is the the solar wind and the appropriate math in Birkeland's book? First asked 7th July 2009
  4. Please cite where in his book Birkeland identified fission as the "original current source" and in the same post
  5. Please cite where in his book Birkeland identified a discharge process between the Sun's surface and the heliosphere (about 10 billion kilometers from the Sun). First asked 7th July 2009
  6. Is your solid iron surface thermodynamically possible? First asked 8 July 2009
    See this post for a fuller explanation of the thermodynamic problems with MM's solid iron surface.
  7. Coronal loops are electrical discharges? First asked 10 July 2009
    This is an updated question with a couple of "answers" from MM.
  8. Can Micheal Mozina answer a simple RD animation question? First asked 10 July 2009
  9. More questions for Michael Mozina about the photosphere optical depth First asked 13 July 2009
  10. Formation of the iron surface First asked 13 July 2009
  11. How much is "mostly neon" MM? First asked 13 July 2009
  12. Just how useless is the Iron Sun model? First asked 13 July 2009
  13. Coronal loop heating question for Michael Mozina First asked 13 July 2009
  14. Coronal loop stability question for Michael Mozina First asked 13 July 2009He does link to his copy of Alfvén and Carlqvist's 1966 paper (Currents in the Solar Atmosphere and A theory of Solar Flares). This does not model what we now know a real solar flare acts like.
  15. Has the hollow Iron Sun been tested? First asked 14 July 2009
  16. Is Saturn the Sun? First asked 14 July 2009(Birkelands Fig 247a is an analogy for Saturn's rings but MM compares it to to the Sun).
  17. Question about "streams of electrons" for Micheal Mozina First asked 14 July 2009MM has one reply in which is mistakenly thinks that this question is about coronal loops.
  18. What is the temperature above the iron crust in the Iron Sun model? First asked 17 July 2009
  19. What part of the Sun emits a nearly black body spectrum with an effective temperature of 5777 K?
    (MM states that it is not the photosphere) First asked 18 July 2009
  20. Is the iron surface is kept cooler than the photosphere by heated particles? First asked 18 July 2009
  21. Entire photon "spectrum" is composed of all the emissions from all the layers First asked 3 August 2009
  22. Same event in different passbands = surface of the Sun moves? First asked 22 July 2009
    Seems to think that 3 pixel differences (full Sun image) or 10's of pixels (limb image) are not detectable. Astronomers would disagree.
  23. Evidence for the existence of "dark" electrons First asked 28 July 2008
  24. Why neon for your "mostly neon" photosphere? First asked 30 July 2009
  25. Where is the "mostly fluorine" layer? First asked 30 July 2009
  26. What is your physical evidence for "mostly Li/Be/B/C/N/O" layers? First asked 30 July 2009
  27. What is your physical evidence for the "mostly deuterium" layer? First asked 30 July 2009
  28. Explain the shape of your electrical arcs (coronal loops) First asked 2 August 2009
  29. What is your physical evidence for the silicon in sunspots? First asked 7 August 2009
  30. How do MM's "layers" survive the convection currents in the Sun? First asked 26 December 2009
  31. Where are the controllable empirical experiments showing the Iron Sun mass separation?
    First asked 5 January 2010
  32. How can your iron "crust" not be a plasma at a temperature of at least 9400 K?
    First asked 7 April 2010
  33. How can your "mountain ranges" be at a temperature of at least 160,000 K?
    First asked 8 April 2010
  34. Where is the spike of Fe composition in the remnants of novae and supernovae?
    First asked 8 April 2010
  35. Which images did you use as your input for the PM-A.gif image, etc.?
    First asked 8 April 2010
Actual Answers From Michael Mozina::dl:
 
In other words, even though brantc went to all the trouble to demonstrate the basic flaw in your argument, and even though I've shown you the satellite images that blow your theory out of the water, you simply ignore them, call them 'gibberish' and go back to pure denial. Yawn.
In other words, you did not understand brantc's post. What a surprise :rolleyes: !
He describes how RD images are made which GeeMack already knows.
He them makes the same ignorant, unsupported and wrong assertion about electrical discharges in plasmas that you make.
The satellite images blow your Iron Sun idea out of the water. He never addresses the simple physics that the TRACE instrument in the 171A pass band can only see light from plasma at > 160,000 K.
The gibberish comes from you.
You are in pure denial (see the list of outstanding questions)
Yawn.
:dl:
 
I asked this a while ago but don't think I saw an answer. Have you found the same 'solid' surface features in images taken on different dates?
 
So, is the Great Red Spot on Jupiter necessarily solid? It's been there for centuries.

Nah. You can watch it "swirl" in the atmosphere like any hurricane from space.

Plasma is however like a dense gas or a liquid. It's mobile by it's nature and unlikely to remain "rigid" in terms of shape, size, etc. The "structures" of the photosphere tend to come and go in roughly 8 minute intervals. That change is obvious. In the RD image, even the CME has very little effect on the overall patterns and their persistence. Some "dust" (for lack of a better term) flies off the CME event and drifts in the plasma atmosphere until it falls back the surface again as "coronal rain". You can even see the pattern changes caused by that process on the image itself. We can even see the "pealing' effect along the right side and the discharges erode surface material in their path.

In the Doppler image, the wave is clear evidence of the validity of Kososichev's technique. It works well and visually demonstrates the moving nature of the wave on the surface of the photosphere. The items I circled are under that wave and are distorted by that wave, but their "lifespan" and "pattern persistence" is unlike anything else in the overall image. We would expect the *ENTIRE* area to show no clear pattern of persistence in terms of shape or size since the whole thing is presumably composed of "flowing plasma". If however there are persistent patterns under the wave (which there are), they can't be made of the same material as the photosphere in terms of density. They aren't even effected by force of the the event that created the wave in terms of their outline, their shape, or their longevity.
 
Last edited:
I asked this a while ago but don't think I saw an answer. Have you found the same 'solid' surface features in images taken on different dates?

Oh, absolutely. The website has a series of RD SOHO images taken from NASA archives that show the same persistence over days. You can download those movies from my website, but the original images actually come from NASA RD archives, I did not personally create them. I simply strung them together in movie format. (Just letting you know, lest GM go ballistic again). :)
 
In other words, you did not understand brantc's post. What a surprise :rolleyes: !

What are you blathering on about? Nobody ever disputed the *TECHNIQUE* of how a RD image is created. I've simply bitched about the fact that GM has *NEVER* put together a solar process with a single observation in any relevant solar RD image of the solar surface in the 195A or 171A wavelengths. The technique has never been in dispute. I'm just waiting for him to "explain" anything in the relevant image in terms of solar physics, solar processes and in terms of the CME event that occurs during the video.
 
How can your "mountain ranges" be at a temperature of at least 160,000 K?

OMG. Do you *EVER* listen or respond to an answer? Your lists are utterly meaningless because you never update them. You simply use it like a sledgehammer and stuff the dog in to give it some air of legitimacy. :) I guess you hope nobody ever reads the thread eh?
 
Perpetual Student does not need to since Dr. Kosovichev has explained the various features of different images as stated on your web site:

No, he didn't explain their persistence in any way. All he did is explain how the technique works and give his opinion that it did not represent something solid. What he failed to do, and never did, even in our emails is offer any sort of satisfactory explanation of the actual "cause" of that persistent pattern. Nothing about his technique "caused" that pattern as the wave clearly demonstrates, as does the overall pattern of "change" in the image. Only certain features under the wave show any persistence and he never offered a valid explanation of the cause of such a feature in the image.

I felt I owed him that quote since I referenced his work, but I also cited the shortcomings of his comments. It's easy to say "I don't think the cause is A), but it's another thing entirely to actually offer a valid B) option. Never did he offer me a B) to choose from, and without an alternative to choose from, A) is still the only option on the table.

If you have a better "explanation" for those persistent patterns, I'm all ears. You're welcome to email him yourself. Links to his website can be found on the tsunami tab of my website. He's a wonderful man, a great scientist and I respect his work. He took the time to answer many of my countless questions and I'm sure if you send him an email, he'll be happy to reply to you.
 
In other words you don't have a reference and you pulled the numbers out of your back pocket. When cornered on the issue, you expect me to do your research. Right.


Let's see, how would Michael Mozina handle this? Oh, yeah. It's somewhere in here.

Now remember, all the professional physicists on Earth generally agree with Dr. Kosovichev on the nature of the Sun's composition. You're the one making a claim that is at odds with all of contemporary physics. You're the one who dangled Kosovichev's research out there as "evidence" to support your crazy claim.

Understand this: Alexander Kosovichev's helioseismology data shows that there is mass moving at over a thousand meters per second up, down, and sideways through and within your supposedly solid surface which, according to any sane person's definition of solid, is impossible. His research is your own reference. His quote on your web site makes it clear that he doesn't accept your claim that there is anything solid there. If you want to show that some other interpretation is legitimate, do your own damned homework.
 
Nah. You can watch it "swirl" in the atmosphere like any hurricane from space.

if you have sufficient resolution, yes. In a blurry, distant image, it looks very static. I glanced through your site and I didn't see any images of 'solid' features that had anywhere near the resolution that you'd need to see the swirling motion of the great red spot, for example. Maybe they're there and I missed them, but . . .

The items I circled are under that wave and are distorted by that wave, but their "lifespan" and "pattern persistence" is unlike anything else in the overall image. We would expect the *ENTIRE* area to show no clear pattern of persistence in terms of shape or size since the whole thing is presumably composed of "flowing plasma". If however there are persistent patterns under the wave (which there are), they can't be made of the same material as the photosphere in terms of density. They aren't even effected by force of the the event that created the wave in terms of their outline, their shape, or their longevity.

The "more persistent so it must not be plasma" argument isn't working for me.
Within our atmosphere, which is paper-thin compared to the photosphere, we often have different layers working almost independently of each other. High- and low-altitude cloud decks move right past each other. Surface-level winds are pretty much independent of the jet stream. In fact, surface-level winds may change direction and intensity on a scale of seconds to minutes; the jet stream changes on a scale of weeks. Yet it's all air, and the surface-level winds are only a few km from the jet stream.
 
Which published paper?


Do your own homework. I gave you the link where you can find a discussion of the issue and further links to the specific material you yourself referenced in that discussion.

Have that running difference video ready yet?
 
What are you blathering on about? Nobody ever disputed the *TECHNIQUE* of how a RD image is created. I've simply bitched about the fact that GM has *NEVER* put together a solar process with a single observation in any relevant solar RD image of the solar surface in the 195A or 171A wavelengths. The technique has never been in dispute. I'm just waiting for him to "explain" anything in the relevant image in terms of solar physics, solar processes and in terms of the CME event that occurs during the video.
That is right: Nobody ever disputed the *TECHNIQUE* of how a RD image is created. And that is what brantc's post is about.

GM probably agrees with what RD movies actually show as far as the terms of solar physics, solar processes and in terms of the CME event that occurs during the video:
  • The light areas are plasma that is heating.
  • The dark areas are plasma that is cooling.
  • These light and dark areas are aligned to either side of flares giving the illusion of "mountain ranges".
  • The moving dark cloud is a moving, cooling CME as stated by the TRACE astronomers.
  • The original images are of plasma at a temperature of > 160,000 K and in the chromosphere and corona, i.e. 1000's of kilometers above the photosphere. The RD processing does not magically change this.
Some other points about the "light sources" in the RD movie:
  • His "shadows" on the TRACE 171A RD animation point in most directions meaning that just about every "shadow" has its own personal light source.
  • There are no multiple "shadows" which means that each light source is a beam on the "mountain" that MM believes is casting the shadow.
  • MM may think that the shadows are a result of the Sun's rotation but then the different directions disproves this.
  • The "shadows" are obviously aligned along the lines of the flares in the original images. They are paired with bright areas that just happen to be on the other side of the flares in the original images.
    This gives the optical illusion of mountain ranges. Thus MM's idea that there are shadows and light sources to cast them.
 
OMG. Do you *EVER* listen or respond to an answer? Your lists are utterly meaningless because you never update them. You simply use it like a sledgehammer and stuff the dog in to give it some air of legitimacy. :) I guess you hope nobody ever reads the thread eh?
OMG. Do you *EVER* listen or respond to an question with anything but gibberish?
I stuff the dog in to give it to show how pitiful you are at answering questions :)
I guess you hope nobody ever reads the thread eh, MM?

How can your "mountain ranges" be at a temperature of at least 160,000 K?
has not been answered in any intelligent sense by you.
The original images in the TRACE RD movie are of light from material at a temperature of > 160,000 K (i.e. plasma) and in the chromosphere and corona, i.e. 1000's of kilometers above the photosphere. The RD processing does not magically change this.
 
Please explain for us why we can see the bases of the coronal loops in 171A from the Trace spacecraft (Blue), but we only observe the the tops of the loops in Yohkoh x-ray images (Yellow)? If the loops are millions of degrees at the bases of the loops as indicated by the TRACE 171A filters, why aren't they emitting x-rays too at the bases of the loops, or why are the x-rays being absorbed near the bases of the loops, and not at the top of the loops?
Another bit ignorance from you MM.

Maybe some baby talk will help:
Thing cool at one end and hot at top. It emit light in 171A band.
Sane thing very hot at above top. It emit light in x-ray band.
Take 2 pictures in the separate bands.
Surprise! One picture shows all of thing. Other picture shows top of thing.
 
They're akin to lightening discharges in the atmospheres of a planet. They aren't limited to a single "layer" of the solar atmosphere.
You do know that the Sun's atmosphere is not the atmosphere of a planet?
That thare are some small difference like it being a plasma?
That electrical discharges are impossible in a plasma becuse it is ionized?

Or are you just ignoring basic physics as usual?

No, that's NOT what it's "designed to do". It is designed to pickup higher energy wavelengths of light from wherever they might occur.
That is correct.
It just so happens that observations and the laws of physics means that light from material at > 160,000 K is only seen from the chromosphere and corona.
The observations are easy: Mask the Sun, look at the light and note that 171A passband light only comes from the chromosphere and corona.

This leaves the possiblity that there is a source of 171A passband light below the photosphere that is as string an emitter as the chromosphere and corona. The optical depth of the photosphere tells us that this source must be in the first few hundred kilometers (1000 km to be generous). But measurements of the photosphere also show that it has a temperature of ~5777 K at the top (lower in sunspots) and that the temperature increases to 9400 K by a depth of 500 km.
There is no material at a temperature of > 160,000 K close enough to the top of the photosphere to emit light in the 171A passband.

But maybe you will continue with your delusion that your thermodynamically impossible, invisible iron crust has electrical discharges that are at > 160,000 K and it is these that TRACE sees.
Big problem with that - you have placed your iron 1000's of km below the photosphere (was it 0.997 of the solar radius?). Any light from your discharges will be scattered multiple times on the way to the top of the photosphere and end up leaving it in a random direction. No "mountain range" illusion :eye-poppi !
 
It's not the "cloud" that is unexplained, it's that outside shell of iron rich materials that really doesn't fit current theory IMO.
Actually the observation of Fe-rich ejecta has been seen in a Type 1A supernova and is explained by current theory. This is interesting stellar physyics.
IRON-RICH EJECTA IN THE SUPERNOVA REMNANT DEM L71 (PDF)

Note that the ejecta as a whole is in a thick egg-shaped shell but the observations do not show a Fe-rich shell within the shell, possible because of low resolution.
 
Do your own homework.

Your claim, your homework dude. I know of no published Kosovichev material that would help you explain the numbers you keep spewing.

Have that running difference video ready yet?

Er, no, I haven't even sat down yet at the machine with IDL and Festival installed. Just out of curiosity what software did you intend to use to create your "real" RD video? How will I know it's "real" rather than "fake"? When can I expect to see it? At least I've had the common decency to post you a link to 4 RD images I personally created, whether you're happy with them or not.
 
Last edited:
Another bit ignorance from you MM.

Maybe some baby talk will help:
Thing cool at one end and hot at top.

Thing plenty hot enough everywhere to emit x-rays everywhere. How it get hot on top and not on bottom?

It emit light in 171A band.

So wouldn't million degree plus plasma be emitting x-rays down at the base of such a loop?

Sane thing very hot at above top. It emit light in x-ray band.

So where does the extra heat come from baby?

Take 2 pictures in the separate bands.
Surprise! One picture shows all of thing. Other picture shows top of thing.

Now all you have to do is explain how multimillion degree plasma below doesn't emit xrays, and where the top of the loops pickup all this extra heat, and why it only happens in the loops.

Think baby think! :)
 
The observations are easy: Mask the Sun, look at the light and note that 171A passband light only comes from the chromosphere and corona.

Sure, "mask the surface" and you can't see light coming right at you from the surface. Duh! :) If you don't mask anything you see plenty of 171A light above and below the surface of the photosphere, all along the loop, from the footprints along the actual solid "surface" and all along the discharge loop, and sometimes way up into the atmosphere, even into the corona. That Hinode video I posted earlier shows the effect of the loop traversing the surface of the photosphere and the effect on the surface of the photosphere. Did you notice that discharge loop streaming down the middle of the umbra in that video?

This leaves the possiblity that there is a source of 171A passband light below the photosphere that is as string an emitter as the chromosphere and corona. The optical depth of the photosphere tells us that this source must be in the first few hundred kilometers (1000 km to be generous).

You evidently pulled that number out of thin air based on what you "assume" the sun to be composed of.

But measurements of the photosphere also show that it has a temperature of ~5777 K at the top (lower in sunspots) and that the temperature increases to 9400 K by a depth of 500 km.

Except somehow you get 4200K plasmas welling up from the umbra of a sunspot, typically right in the middle of the sun's most active areas as seen in 171A. How's that work RC?

There is no material at a temperature of > 160,000 K close enough to the top of the photosphere to emit light in the 171A passband.

This is like claiming that the atmosphere of the Earth is far too cool to emit gamma rays, therefore it's impossible that the atmosphere could emit them.

http://www.universetoday.com/2005/02/23/gamma-rays-come-from-the-earth-too/

Ooops? Your logic doesn't apply in a discharge heavy environment RC. It's childish in fact to suggest that you know for sure they can't occur lower inside a relative "cool" atmosphere. You're "winging it". In fact the gamma rays tend to concentrated lower in the atmosphere, whereas the neutron capture events tend to occur in the corona.

But maybe you will continue with your delusion that your thermodynamically impossible, invisible iron crust

Dead strawman alert.
 
Your claim, your homework dude. I know of no published Kosovichev material that would help you explain the numbers you keep spewing.


Okay, I guess you're not quite the expert on solar physics that you claim to be. The numbers are in material you referenced. Like I said, you should have taken notes. So sorry.

Er, no, I haven't even sat down yet at the machine with IDL and Festival installed. Just out of curiosity what software did you intend to use to create your "real" RD video? How will I know it's "real" rather than "fake"? When can I expect to see it? At least I've had the common decency to post you a link to 4 RD images I personally created, whether you're happy with them or not.


Funny how you can't explain the process you used to create those bogus images you linked. Looks like you're trying to pull a fast one by running a couple of PhotoShop filters on an image and passing off the results as a fraudulent "running difference" image. I can pretty much reproduce your fakes by exactly that method. But you could clear up this whole matter and avoid making yourself look even less qualified than you do right now, by just describing which PhotoShop filters you used and how you believe it makes a running difference image. (We're all pretty sure you won't because you can't. :D)

Oh, and I don't intend to make a running difference video. I already made them. I made one each from all four of the videos at the top of this page. You should, too. After all, for an expert like you, it shouldn't take any time at all. Do the EIT 171Å, EIT 195Å, EIT 284Å, and the EIT 304Å. Oh, and you'll know mine are real if you actually understand how a running difference video is created because they'll look just exactly like the ones you're going to make! :D

I've already sent one to another participant in this discussion.

Let us know when you post your finished videos.
 
Sure, "mask the surface" and you can't see light coming right at you from the surface. Duh! :) If you don't mask anything you see plenty of 171A light above and below the surface of the photosphere, all along the loop, from the footprints along the actual solid "surface" and all along the discharge loop, and sometimes way up into the atmosphere, even into the corona.


Amazing how many times you can read the explanations as to why this is completely wrong and still insist on repeating it. Time machine. 2005. The physics is still the same. You're still so wrong it's laughable.
 
Sure, "mask the surface" and you can't see light coming right at you from the surface. Duh! :)
You mask the surface to measure the temperature of the chromosphere and corona. That is really basic.
Duh! :)

You evidently pulled that number out of thin air based on what you "assume" the sun to be composed of.
No. The is what the science states.

Let's go over it one more time for the ignorant and delusional:
  • The photosphere has a certain observed composition.
  • It is at a temperature which means that it is a plasma.
  • A plasma with that composition has a certain optical depth.
  • It is complicated to calculate the opacity of the plasma but it has been done and you can use the standard tables to calcuate the optical depth of the Sun's photosphere.
Except somehow you get 4200K plasmas welling up from the umbra of a sunspot, typically right in the middle of the sun's most active areas as seen in 171A. How's that work RC?
I do not know. Convection is my first thought.
First asked 9 April 2010
How's that work MM?

This is like claiming that the atmosphere of the Earth is far too cool to emit gamma rays, therefore it's impossible that the atmosphere could emit them.
No it is not.
There is no material at a temperature of > 160,000 K close enough to the top of the photosphere to emit light in the 171A passband. That is a fact because the temperature of the photosphere has been measure with depth.

The material at a temperature of ~9400 K as below the photosphere will emit light in the 171A passband and even x-rays. But in small, undetectable amounts, e.g. the emission will be roughly black body and so will fall off from the peak at the effective temperature of ~9400 K .

Ooops? Your logic doesn't apply in a discharge heavy environment RC. It's childish in fact to suggest that you know for sure they can't occur lower inside a relative "cool" atmosphere. You're "winging it". In fact the gamma rays tend to concentrated lower in the atmosphere, whereas the neutron capture events tend to occur in the corona.
Once more with the idiotic discharges in a plasma with a temperature of at last 9400 K.

Dead strawman alert.
Dead crank idea alert.
:dl:

As asked in 8 July 2009.
Can you show that the solid iron surface in your idea is thermodynamically possible?
(The answer has been pointed out to you for many years (since 2006?) and many times in this thread and many times in the other thread.)
That is either your iron crust
  • would not have heated up to the temperature of the surrounding layers in the last ~4 billion years and vaporized or
  • the temperature of the surrounding layers are less than the boiling or melting point of iron.
We have not been through this before because you cannot comprehend what "hypothetical, thermodynamically impossible, solid iron surface" is referring to.

It is not "solids being ionized by arcs".

It is the second law of thermodynamics.

It is that fact that your notion has a cool layer of iron in contact with at least one hotter object - the photosphere whose temperature is measured to increase with depth from the top. If your notion has an internal energy source of any sort that outputs the amount of energy that the Sun is observed to emit then then the Sun below your iron layer is also hotter than the melting temperature of iron.

To make it obvious:
Your hypothetical, thermodynamically impossible, solid iron surface has been in thermal contact with at least one object that has consistently had a temperature large enough to vaporize iron for about 4.57 billion years.

It cannot exist.
Your "layers" between the "surface" and photosphere do not help.
  • The layer below the photosphere has been in thermal contact with an object (the photosphere) that has consistently had a temperature large enough to vaporize iron for about 4.57 billion years.
    Try to guess the temperature of that layer.
  • The layer below that one has been in thermal contact with an object that has consistently had a temperature large enough to vaporize iron for slightly less than 4.57 billion years.
    Try to guess the temperature of that layer.
  • The layer below that one has been in thermal contact with an object that has consistently had a temperature large enough to vaporize iron for a smidgen less than 4.57 billion years.
    Try to guess the temperature of that layer.
  • ...
  • Now we get to the iron layer which has been in thermal contact with an object that has consistently had a temperature large enough to vaporize iron for a bit less than 4.57 billion years.
    Try to guess the temperature of that iron surface and whether it is solid.
 
Last edited:
Thing plenty hot enough everywhere to emit x-rays everywhere. How it get hot on top and not on bottom?
Ice how enough to emit x-rays but not measurable.
Thing get only got enough at top to emit measurable x-rays.

So wouldn't million degree plus plasma be emitting x-rays down at the base of such a loop?
No million degree plus plasma at the footprint of the loop in the photosphere.
No million degree plus plasma at the base of the loop in the 171A band which excludes x-rays.
Million degree plus plasma at the top of the loop emits lotsa x-ray.

So where does the extra heat come from baby?
I do not know. Probably magnetic reconnection. Do you know baby?

Now all you have to do is explain how multimillion degree plasma below doesn't emit xrays, and where the top of the loops pickup all this extra heat, and why it only happens in the loops.

Think baby think! :)
No million degree plus plasma at the footprint of the loop in the photosphere.
No million degree plus plasma at the base of the loop in the 171A band which excludes x-rays
Million degree plus plasma at the top of the loop emits lotsa x-ray.

No need to explain. It happens. Get over it baby. :D

You no think baby! :)
 
I still haven't seen your explanation of that persistent feature in Kosovichev's Doppler image PS.

There is no necessity for me to explain any such a thing. There is a vast body of scientific knowledge that experts in one field cannot explain if it is not within their area of expertise. They rely on the specialists who work within the area in question.
For example, I am not a biologist yet I know that the theory of evolution is correct. If I were challenged by someone who rejected evolution, who demanded that I must personally explain some aspect of the fossil record, I would similarly refuse to accept such a notion.

Further, you have clearly demonstrated without any doubt that you have no expertise in solar physics, an area in which I am certain you also have no credentials.

So again, here is my image of you (hint: you do not have the hammer):
:hit:
 
Last edited:
Coronal loops are electrical discharges - part 2

Once more with the idiotic discharges in a plasma with a temperature of at last 9400 K.
This reminded of your claim that coronal loops are electrical discharges.
Not only is this impossible in a plasma (even a dusty plasma) but the x-ray spectrum from electrical discharges is not concentrated at the top of the discharge, AFAIK. I asked you previously for the spectrum (see below) but this demands a separate question.

First asked 9 April 2010
Micheal Mozina,
What is the distribution of the x-ray emission from an electrical discharge along the discharge?
It should be concentrated at the top of the electrical discharge loop as observed for coronal loops.


First asked 9 July 2009 (Updated 6 August 2009)
From your web site and what you have stated here, it looks like you have an idea that coronal loops are electrical discharges from your hypothetical, thermodynamically impossible iron crust .
AFAIK The only evidence that you have presented is that they look like the electrical discharges in the experiments that Birkeland did.

Could you present your calculation of the X-ray spectrum from the electrical discharges so that we can see if it matches the observed X-ray spectrum.

Otherwise we will have to assume that the X-ray spectrum from the electrical discharges is like all other observed electrical discharges - narrow bands of emission (a real astronomer may want to confirm this).
So I would expect electrical discharges on the Sun that heat plasma to have an X-ray spectrum that has a broad background with spikes of emission.
This is a problem for your idea because the observed X-ray spectrum is broad band and typical of heated plasma alone.

MM:
"Bruce's material" does not contain a calculation of the X-ray spectrum from the electrical discharges. He states is that they are like lightening. His model is not the Iron Sun model. His model is fatally flawed because is assumes dust particles in the photosphere (which he assumes to be ~4000 K).
Also
"Alfven's material" is presumably his copy of Alfvén and Carlqvist's 1966 paper (Currents in the Solar Atmosphere and A theory of Solar Flares).
This does not contain a calculation of the X-ray spectrum of electrical discharges. This does not model what we now (2009) know a real solar flare acts like.[/
 
Photosphere, Sunspots, Helioseismology

As to the photosphere
You simply *assume* it heats up below the photosphere.
Absolute rubbish. Nobody "assumes" any such thing.
Limb observations of the sun make it possible to retrieve the temperature structure of the photosphere as a function of depth, in much the same way as limb observations of Earth's atmosphere by satellites allows us to retrieve temperature profiles for the Earth's atmosphere (see, e.g., Solar Astrophysics by Peter Foukal, Wiley-VCH 2004, chapter 5: "The photosphere"; The Observation and Analysis of Stellar Photospheres by David Gray, Cambridge University Press 2005, 3rd edition). The temperature at the lowest level we can determine is 9400 Kelvins.
Oh Boloney! Why did they name the spacecraft "Trace" in the first place Tim? They made their mistake before launch the day they named the damn thing, before they even took a single solar image.
Transition Region and Coronal Explorer. What has that got to do with the temperature profile of the photosphere, which is derived from Earth based observations? You have avoided the issue altogether. One can only assume that you avoid the issue because ... You want the truth? You can't handle the truth! Everything I said stands unchallenged. You are trying too stick an iron crust right next to a plasma of minimum temperature 9400 Kelvins, and physics does not allow that. The Mozina Model is dead, slain by inconvenient facts.

And as for sunspots ...
Most of the studies of sunspots reveal they have *COOLER* plasma in them. How is that possible if the temperature under the photosphere 'heats up'? Where does that lower temperature plasma come from if not from under the photosphere?
Pay attention.
But the situation for sunspots is much different. The density of material inside a sunspot is not significantly different from the density outside the sunspot. But the sunspot remains relatively cool because the surrounding magnetic field inhibits convective energy transport into the sunspot. But this magnetic field does not interfere with radiative heat transport at all. That's why sunspots can't get cooler than about 3200 Kelvins. And note that your 3180 K is still 46 K in excess of the boiling point of iron, so this does not help your cause if your cause is a solid & rigid shell.
This is where you guys turn magnetic fields into pure magic entities. You have them "cooling" hundreds of kilometers of plasma, and creating million degree coronal loops above them when you want them too. It's cool but somehow hot too? Nice trick if you never have to demonstrate any of it empirically.
Again, Mozina rants & talks trash, but has nothing intelligent to say. The ability of magnetic fields to inhibit convective heat transport is well known & well established, and indeed fairly obvious: Plasma does not cross magnetic field lines. The physics is well described in any number of sources, e.g., Solar Astrophysics by Peter Foukal (Wiley-VCH, 2004 2nd revised edition), section 8.2.2 "Why Spots Are Cool" ...

The most promising explanation of the spots coolness, and the fate of the missing energy, seems to lie in the blocking of convection by intense vertical magnetic fields. This explanation was first put forward by Biermann in 1941, and some recent evidence tends to strengthen the argument. The basic idea is that the horizontal motions of overturning convection are inhibited by the magnetic volume force jxB in the presence of a strong vertical magnetic field. ... In this explanation of the spot coolness, an equilibrium would be reached in which the convective heat flux blocked below the spot would simply flow around it ...
Solar Astrophysics, Peter Foukal, 2nd ed. 2004, page 250. See the book for complete details.

Helioseismology is well known to validate the standard model of the sun, which requires the temperature to continue increasing below the photosphere.
Helioseismology depends on a "reflective surface' and it wouldn't work out all were it now for the crust. You can even see it's effect on Nickel ions in the Doppler images Kosovichev has personally created. There's no point in ignoring the *REASON* it works in the first place. You need a reflective surface to do that, and the density of the top of the photosphere is simply way too thin to even begin to explain that reflective process.
Helioseismology does not require any reflective surface beyond the obvious "surface" where the solar gas density drops precipitously before we encounter empty space. Certainly any kind of crust or hard surface is emphatically not at all required for helioseismology to work. These aspects of helioseismology are extremely well documented for anyone who cares to pursue the matter ...
Actually, GeeMack is quite correct, and you are way wrong. Helioseismology is extremely supportive of the standard model. This is extensively documented in the literature; e.g., Helioseismology, Jorgen Christensen-Dalsgaard, Reviews of Modern Physics 74(4): 1073-1129, November 2002; The Internal Rotation of the Sun, M.J. Thompson, et al., (not me & no relation that I know of), Annual Review of Astronomy and Astrophysics 41: 599-643 (2003), and the many citations to both. More recently, see M.J. Thompson, 2010; Gizon, Birch & Spriut, 2010; Solar Interior Rotation and its Variation, Rachel Howe, Living Reviews in Solar Physics 6(1), February 2009 (free access online); Zhao, et al., 2009; Chaplin & Basu, 2008; Christensen-Dalsgaard, 2007; Gough, 2006 & etc. Finally, see the book Stellar Astrophysical Fluid Dynamics, edited by M.J. Thompson & Jorgen Christensen-Dalsgaard, Cambridge University Press 2003.

The idea that a bounded sphere is implied by helioseismological data is unacceptable, and very much contradicted by the weight of scientific study of the topic.

See also Kosovichev, 2009: "Acoustic waves with frequencies below the cut-off are completely reflected by the surface layers because of the steep density gradients. These waves are trapped in the interior, and their frequencies are determined by the resonant conditions, which depend on the solar structure. But the waves with frequencies above the cut-off frequency escape into the solar atmosphere. Above this frequency the power spectrum peaks correspond to so-called "pseudo-modes". These are caused by constructive interference of acoustic waves excited by the sources located in the granulation layer traveling upward, and the waves traveling downward, reflected in the deep interior and arriving back to the surface. Frequencies of these modes are no longer determined by the resonant conditions of the solar structure. The depend on the location and properties of the excitation source ("source resonance"). ..." This is all very standard physics of waves; it is much the same principle used for interference filters, and is the same physics that produces "skip" for ham radio operators (radio waves reflecting off the ionosphere) and is responsible for the Schumann Resonance on Earth. In this sense, both acoustic waves and electromagnetic waves behave in much the same way, because they are both waves.

So, waves trapped in the deep interior, below the cut-off frequency, are the waves we use to validate the deep internal structure of the sun (they are responsible for the systematic changes in solar radius that correspond to the long term vibrations). The waves that make it into the atmosphere are the convection driven waves, and they are used to diagnose the physics of the solar (stellar) atmosphere. The many sources I have cited above will explain all of this in greater detail.

The fact remains that the physics based arguments that I and others have made are answered by rants and gibberish, avoiding any science, physics, or even common sense. Neither Mozina nor brantc have any intelligent points to make regarding the absolute impossibility of any iron crust or surface or anything that looks like a crust or surface. The Mozina/brantc models are inescapably ruled out by fundamental physics in an absolute and convincing manner.
 
The real issue is real physics

I still haven't seen your explanation of that persistent feature in Kosovichev's Doppler image PS.
There is no necessity for me to explain any such a thing.
Our friend the student is correct. The Mozina explanation for the persistent features is known to violently violate the laws of physics, rendering it an absolute impossibility. That fact remains intact, quite regardless of anyone else's proposed explanation, or lack thereof. The constant demand for others to explain these features is just one more in a long list of "red herrings", an attempt to deflect the discussion away from the real issue, namely the impossibility of any iron crust or surface. Mozina simply cannot or will not deal with the central issue, for whatever reason, and that is the central lesson of this entire discussion.
 
Solar Surface Fusion? Not Likely.

There's a problem however once you get the atmosphere of the sun. Without electricity, you simply don't have the conditions necessary to explain fusion, and yet fusion does occur inside coronal loops above the photosphere of the sun. How? Why?
The first link is a bare abstract with no associated paper available, and no citations despite being published in 1977. The abstract reads ...

Nuclear reactions triggered in the solar atmosphere by flare-accelerated charged particles are investigated. Consideration is given to reactions of protons with hydrogen, helium with CNO nuclei, alpha-particles with hydrogen and helium, and energetic CNO nuclei with hydrogen. Experimentally determined cross sections for these reactions are examined, the production of solar neutrinos by flare-accelerated particles is analyzed, and the neutrino energy distributions resulting from different nuclear reactions are determined. The basic mathematical equations for calculating the output of secondary products during accelerated-particle interactions with ambient matter are outlined, and the formation of H-2, H-3, and He-3 isotopes in flares is reviewed. Near-earth neutrino fluxes are estimated for several flares, and gamma-ray line emission during flares is studied in detail.
Unfortunately, while the abstract tells us what was studied, it does not tell us what conclusions were reached, so there is not much here to work with. The next to last sentence talks about the formation of deuterium (2H), tritium (3H) and 3He, but these are all neutron capture reactions and certainly do not count as nuclear fusion, since there is no Coulomb barrier involved. I am unaware of any reliable published record of CNO reactions, or proton fusion reactions taking place in solar flares. This abstract is not explicit in any way of saying that such reactions actually take place, saying only that they were considered. We need a more definitive & informative source than this.

The second link is for the paper by Mozina, Ratcliffe & Manuel, and is entitled "Observational confirmation of the Sun's CNO cycle". The title is a sham, as the paper in fact does no such thing, and in fact presents no evidence at all related to the CNO cycle. Rather, the authors use the observation of electron-positron annihilation (511 kev line emission) and neutron capture (2.2 Mev line emission) to infer, without justification, that unseen CNO fusion created the positrons and neutrons. it is an insipid paper, which is why nobody ever paid it any mind besides the authors. How it ever got published in any journal is a mystery to me.

Neither of these links is worth spit. I am aware of no evidence for any nuclear fusion taking place anywhere near the surface of the sun. Produce more informative & reliable sources and we will have something to talk about.
 
Iron in Supernova Remnants

Why in the world is the there an "iron rich shell" around the outside of the explosion RC?
The iron is formed by decay processes in the supernova remnant. 56Fe is the dominant isotope of iron (91.72% of all iron); 56Ni decays by electron capture to 56Co with a half life 6.08m days and 56Co decays by electron capture to 56Fe with a half life of 77.3 days. Copious amounts of 56Ni are formed in type I supernovae, with smaller amounts from core collapse supernovae, although the latter are quite a bit more common. The iron in the core of a core collapse supernova is almost all lost to the formation of a neutron star or black hole. So the iron in fact is generated from Nickel in the supernova remnant. This was all figured out long ago and no shell of iron around the star is needed to explain any of it. See, e.g., Handbook of isotopes in the Cosmos by Donald Clayton, Cambridge University Press 2003.
 
Emphasis mine. Why in the world is the there an "iron rich shell" around the outside of the explosion RC?
As Tim Thompson notes: Supernovae produce iron by the decay of nickel isotopes.

What is important is the prediction from the Iron Sun model of the percentage of iron in a supernovae and it's agreement wiuth the observations.
Let see now ... where is that Iron Sun model which produces actual predictions again?

That's right you do not have one :jaw-dropp!
All you have is an idea for a thermodynamically impossible iron crust that you fantasize about seeing in running difference images of the corona.
 
Last edited:

Ok. As Tim Thompson has already noted the one link is only an abstract which refers to “Nuclear reactions triggered in the solar atmosphere by flare-accelerated charged particles…” , but makes no mention of fusion occurring “inside coronal loops above the photosphere of the sun”.

The second link is a paper authored by you and two others. However, it was already obvious that you were hoping someone could explain fusion “inside coronal loops above the photosphere of the sun” form your post that I questioned.

There's a problem however once you get the atmosphere of the sun. Without electricity, you simply don't have the conditions necessary to explain fusion, and yet fusion does occur inside coronal loops above the photosphere of the sun. How? Why?
http://svs.gsfc.nasa.gov/vis/a000000/a002700/a002750/


So the problem you mention above is simply yours (and perhaps those other two authors). Not that it matters much anyway as electricity is still not a requirement for fusion or “to heat plasma to millions of degrees”. In fact as Tim Thompson notes above the Coulomb barrier must be overcome so it is basically electricity (more specifically the repulsion of the charged protons) that prevents fusion from occurring more easily (requiring less energy input).
 
No, he didn't explain their persistence in any way. All he did is explain how the technique works and give his opinion that it did not represent something solid. What he failed to do, and never did, even in our emails is offer any sort of satisfactory explanation of the actual "cause" of that persistent pattern. Nothing about his technique "caused" that pattern as the wave clearly demonstrates, as does the overall pattern of "change" in the image. Only certain features under the wave show any persistence and he never offered a valid explanation of the cause of such a feature in the image.

hiliting mine.


Could it be that you simply don't understand his answers?
 
Oh, absolutely. The website has a series of RD SOHO images taken from NASA archives that show the same persistence over days. You can download those movies from my website, but the original images actually come from NASA RD archives, I did not personally create them. I simply strung them together in movie format. (Just letting you know, lest GM go ballistic again). :)

Sorry I should have been more clear. We've all seen non-solid features persist a couple days, like sunspots. What we're talking about here is a solid surface, those features should be relatively permanent. Have you made any images months apart that have anything in common?

If it's solid and you can image it, you should be able to map it, right?
 
The numbers are in material you referenced.

BS. What material???????!??????!????

Like I said, you should have taken notes. So sorry.

Either produce the paper, or stop pulling numbers and claims right out of your *ss.

Funny how you can't explain the process you used to create those bogus images you linked.

I did them three years ago, and I honestly I can't even remember whether I did them in IDL and Festival or Photoshop with FITS extensions. It wouldn't matter one way or the other mind you, I just don't actually remember anymore which software was used to create which image.

Looks like you're trying to pull a fast one by running a couple of PhotoShop filters on an image and passing off the results as a fraudulent "running difference" image.

What a crock. It is certainly possible to create a "running difference image" in Photoshop and I have personally done so. The fact you think they can't be adequately produced in Photoshop says volumes. Evidently you have some personal and irrational beef with Adobe too?

I can pretty much reproduce your fakes by exactly that method.

So do it and show us how that makes them "fake". You do realize that Photosphop has a legitimate "substract" feature, right? Is it a "fake" subtraction feature or a "real" one?

But you could clear up this whole matter and avoid making yourself look even less qualified than you do right now, by just describing which PhotoShop filters you used and how you believe it makes a running difference image. (We're all pretty sure you won't because you can't. :D)

For the record, absolutely "real" RD images can be produced in Photoshop that rival the ones created in Solarsoft/ITT libraries. A RD image is not "real" or "fake" only because it was produced in some specific software program. You're full of it.

Oh, and I don't intend to make a running difference video. I already made them.

Let's see them. How do I know they are 'real'? What software did you use? Were the from the last couple of days? Did you *PERSONALLY* make them yourself or get them from someone else?

Prove they aren't "fake" and explain what makes them "real" and how we can all be sure that they are "real", not to mention that you made them yourself.
 
Last edited:
Sorry I should have been more clear. We've all seen non-solid features persist a couple days, like sunspots. What we're talking about here is a solid surface, those features should be relatively permanent. Have you made any images months apart that have anything in common?

If it's solid and you can image it, you should be able to map it, right?

Well, sure I could map it if I wanted to map a highly volcanic surface that's constantly changing over time. It's not all the productive in my experience.

I have in fact compared RD image surface features in SOHO images over a full rotation cycle (27.3 days) but even then there are obvious and sometimes significant changes over that timeline, particularly during active phases where the volcanic activity is constant and occurs all along the surface.

If you look closely at the gold RD LMSAL image, you'll actually see surface erosion along the bottom right hand side just after the main event due to the electrical processes that create the coronal loops. It literally "peals" particles from the surface and ionizes them in the loop. That electrical erosion process shows up in the RD images too, as you can see from the video. There are changes to the surface that occur for a variety of reasons, so any surface "maps" would need to be constantly updated.
 
Transition Region and Coronal Explorer. What has that got to do with the temperature profile of the photosphere, which is derived from Earth based observations?

The point Tim is that they *ASSUMED* before they took their first picture of the sun that there was some magical upper atmospheric "region" where a "transition" occurred in the plasma as though it were some layer far above the photosphere, somewhere between the lower corona/upper chromosphere.

They *ASSUMED* a location Tim.

What they "observed" doesn't fit that model, not even slightly. In fact the 171A footprints *DO NOT* originate in some mythical "transition region" above the photosphere as they *ASSUMED* before launch, but actually they originate *UNDER* the photosphere. They've never abandoned their flawed assumption even though the images blow their "transition region" theory out of the water. The loops span the whole atmosphere Tim, from the "surface" far below the photosphere, to way into the corona. They aren't limited to a singular magical "transition region", they are ordinary discharges occurring throughout the whole atmosphere.

The certainly originate below the photosphere Tim as I was attempting to demonstrate to you with that white light image.

15%20April%202001%20WL.gif


That Hinode video I posted earlier shows the same process of the loops coming up and through the surface of the photosphere, lighting up the surface of the photosphere as they pass through it, and rise into the corona.
 
I'm still waiting for you to figure out the gravitational pressure for a water bubble floating in space. You claimed that the example of such water bubbles invalidated my reasoning regarding the collapse of a solid shell the size of the sun. But you never demonstrated this to be the case. It's an easy calculation to do, Michael. Why can't you?

Because you can't quantify anything. Not once have you ever calculated any quantitative features of your model. And I feel quite confident that you will not now. Instead, you will object that you won't "bark math on command" to try to disguise the fact that you can't quantify your model, and if you did, its absurdity would become immediately evident. You complain endlessly that existing stellar models are not consistent with all observations, but since you can't quantify anything, how can you claim that your model is consistent with any observations? You cannot.
 
BS. What material???????!??????!????


Why, Dr. Kosovichev's helioseismology research, of course. You know, the guy who you've quoted there on your web site saying the Sun doesn't have a solid surface? I thought you were familiar with his work in this area. Looks like you're proving yourself to quite a failure at this solar scientist game you're playing.

Either produce the paper, or stop pulling numbers and claims right out of your *ss.


Produce it yourself. There's a great deal of discussion on that particular issue here in this 2,700 post discussion. But if you can't be bothered to, you know, do a little research to find some data that you yourself presented, I understand. The hard work always does seem to be left to the real scientists, now doesn't it?

I did them three years ago, and I honestly I can't even remember whether I did them in IDL and Festival or Photoshop with FITS extensions. It wouldn't matter one way or the other mind you, I just don't actually remember anymore which software was used to create which image.


And as a bit of a graphics expert myself, I'm calling fraud. I think you've twiddled with a couple filters in PhotoShop to get something you think looks like running difference images. I say you don't know what you're doing and you've faked it. You claim they're running difference images, so if you expect anyone to accept your claim, you'll have to describe the method you've used to make them. After all, I've described the method I use and LMSAL has been pretty forthcoming about the method they use. But if you don't want to actually substantiate your claim, that's okay. I understand that some of the hard work can only be done by real scientists.

What a crock. It is certainly possible to create a "running difference image" in Photoshop and I have personally done so. The fact you think they can't be adequately produced in Photoshop says volumes. Evidently you have some personal and irrational beef with Adobe too?


Well then, if it certainly is possible to create a running difference image in PhotoShop, and if indeed that's what you've done to make those you claim actually are the real thing, then it shouldn't be too much to ask you to support your claim and explain the process you used. But, like I said before, I can understand why you'd want to avoid that and leave the hard work to real scientists.

So do it and show us how that makes them "fake". You do realize that Photosphop has a legitimate "substract" feature, right? Is it a "fake" subtraction feature or a "real" one?


Let's see, you make a claim that something is real, and then you want me to make some fake ones to show that you didn't make real ones? All those years of pretty much everyone trying to explain to you the burden of proof issue and it still hasn't sunk in, I see. Well that's okay, I can certainly understand why you'd make a crackpot claim about the surface of the Sun, and several claims about the "evidence" that you offer, and refuse at every turn of the corner to actually back up your claim or detail your "evidence" with any more than whining and complaining. Because it's unsupportable. You know, real science takes actual work and understanding. Maybe you want to let the real scientists handle it.

For the record, absolutely "real" RD images can be produced in Photoshop that rival the ones created in Solarsoft/ITT libraries. A RD image is not "real" or "fake" only because it was produced in some specific software program. You're full of it.


For the record, you haven't done anything about this but scream and holler. For the record, there is no record of you demonstrating any understanding of how a running difference image or video is created, what the source data means, and what the output graph means. You have claimed to create some yourself, but when asked how you made them, you'd rather throw a tantrum than to simply answer the question. But that's okay, Michael. I understand. It is always best to leave the hard work of real science to the real scientists.

Let's see them. How do I know they are 'real'? What software did you use? Were the from the last couple of days? Did you *PERSONALLY* make them yourself or get them from someone else?


Okay, now I know you don't read these replies before you launch into a defensive tirade...


Oh, and I don't intend to make a running difference video. I already made them. I made one each from all four of the videos at the top of this page. You should, too. After all, for an expert like you, it shouldn't take any time at all. Do the EIT 171Å, EIT 195Å, EIT 284Å, and the EIT 304Å. Oh, and you'll know mine are real if you actually understand how a running difference video is created because they'll look just exactly like the ones you're going to make! :D

I've already sent one to another participant in this discussion.

But hey, not a problem that you'd overlook it. I understand that being attentive to details is for real scientists.

Prove they aren't "fake" and explain what makes them "real" and how we can all be sure that they are "real", not to mention that you made them yourself.


I already told you, you'll know the running difference videos I've made are real when you post yours for comparison. Mine will look like yours and they'll all look like the ones made by NASA and LMSAL. You remember LMSAL, the place where Dr. Hurlburt runs the solar imaging department? You remember Dr. Hurlburt, the fellow who explained the process of creating running difference videos to me?

So here's where you are so far: Your claim about these images and videos is in direct contradiction to the position of the good folks at LMSAL and NASA, not to mention me and every other person who has been involved in discussing your crackpot notion (well, and except brantc, member of the German Jr. Scientist Club). It is based on your boldly asserted but wholly unevidenced claim to be qualified to understand the construction and meaning of running difference graphs. Your qualifications have been challenged. Your response so far? Predictably you've thrown another tantrum.

So Michael, how's it coming? Have those videos ready yet?
:dl:
 
Status
Not open for further replies.

Back
Top Bottom