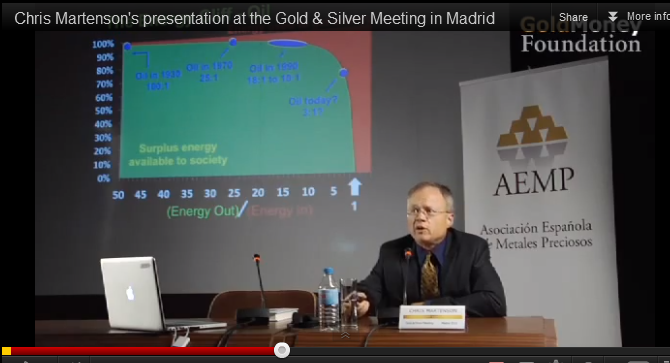
What is "The Pattern"?

it is critical however to understand the exponential function properly, did you know for example that in the last 23 years, we have burnt half of the total amount of oil ever pumped?

oil useage is accelerating and there is a finite production threshold. fact.

If we have burnt half in the last 23 years and it's an exponential function as described, wouldn't we already be out?

What is the time scale on the graph? It seems a trivial thing to predict collapse within plus or minus a year (or less, depending on the size of your 'tick'). This would be a useful thing to know.

What date has been arrived at (and what are the error bars)?
 
Last edited:
If we have burnt half in the last 23 years and it's an exponential function as described, wouldn't we already be out?

obviously demand isnt doubling every time unit, but 7% a year, for 10 years is doubled useage.

What is the time scale on the graph? It seems trivial thing to predict collapse within plus or minus a year (or less, depending on the size of your 'tick'). This would be a useful thing to know.

What date has been arrived at (and what are the error bars)?

another screenshot from the video (you need to watch) , showing dates on the curve.

17852504a2b425c22b.png


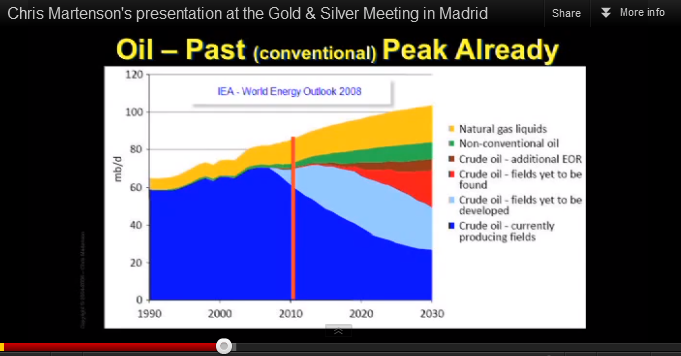
and a bonus one for you.

17852504a2c2cf0a92.png


blue at the bottom is cheap and easy oil fading away. my favourite bit is the red, "the wedge of hope" - fields we *think* we are going to find.
 
obviously demand isnt doubling every time unit, but 7% a year, for 10 years is doubled useage.
(graphs)
blue at the bottom is cheap and easy oil fading away. my favourite bit is the red, "the wedge of hope" - fields we *think* we are going to find.

Thank you, and thanks for the graphs. The second one, depending on the "wedge of hope" either shows the crisis happening in 2020 or sometime after the edge of the graph (after 2030). What do you think?

I'd also point out the second graph doesn't quite have the precipitous drop as the first. I couldn't make out the dates and promise to watch the video soonest.
 
Thank you, and thanks for the graphs. The second one, depending on the "wedge of hope" either shows the crisis happening in 2020 or sometime after the edge of the graph (after 2030). What do you think?

I'd also point out the second graph doesn't quite have the precipitous drop as the first. I couldn't make out the dates and promise to watch the video soonest.

The crisis has already started. It started in 2008.

The global financial/debt/monetary crisis that exploded in 2008 has been 60 years in the making. You have to trace the history back to the end of WWII, when most of the world was both bankrupt and in ruins. The US was untouched, and held half of the world's gold reserves. As a result, the US got to choose what monetary system was created, and it was a gold-backed dollar instead of what everybody else wanted, which was a currency backed by a basket of commodities. This system put the US at a great advantage, but it only lasted until the early 1970's, when two things happened to force the US Nixon to "close the gold window." The US was a losing in Vietnam just as it passed its own internal peak oil (bang on time, as predicted by M. King Hubbert.) This prompted the US to print more dollars than it had oil, and that in turn provoked various nations, including France, to ask for their gold in return for dollars. So Nixon de-linked the dollar from gold, and since then we've had a monetary system based on nothing but a US promise not to get into a debt spiral and then try to print money to escape from it. Add in to that the deregulation of the banking industry and you have an enormous accident waiting to happen.

BUT...the reason it happened in 2008 - the proximal cause - was peak oil. It was rising fuel and food prices that caused people in the US who should never have been given mortgages in the first place to start defaulting, and that eventually brought the whole house of cards down. Or at least it would have, had the powers that be not spent the last 4 years holding the system together with increasing amounts of sticky tape and propaganda (and rigging of statistics and manipulation of markets, etc...).

The ongoing relevance of peak oil is that it will prevent any global economic recovery, which in turn makes it absolutely inevitable that the western world cannot escape from the debt death spiral.

The whole system is broken. It is now just a matter of time before this fact can no longer be hidden. We are seeing it being exposed right now in the eurozone, because the political situation there is making it impossible for the bankers and politicians to conspire to hide the fact that it is broken.

My own guess is that the next stage of the crisis will begin at the end of this year, after the election in the US and before Christmas. This is likely to involve a widespread panic as more and more people realise that the banking system is totally pranged, and that their money is not safe in the bank. This will lead to a flight to hard assets, when all that money that has been printed in the last 4 years and is currently sitting on the balance sheets of banks and the bank accounts of the 1% suddenly starts moving. This will unleash an unstoppable wave of inflation, while at the same time the deflationary pressure on wages will be enormous. This in turn will lead to civil unrest and in some places to revolution.

If you want to know what happens after that, I'd recommend The Long Descent by John Greer.
 
The crisis has already started. It started in 2008. (some snipped)

BUT...the reason it happened in 2008 - the proximal cause - was peak oil. It was rising fuel and food prices that caused people in the US who should never have been given mortgages in the first place to start defaulting, and that eventually brought the whole house of cards down. Or at least it would have, had the powers that be not spent the last 4 years holding the system together with increasing amounts of sticky tape and propaganda (and rigging of statistics and manipulation of markets, etc...).

Well, just doing the math, it doubles every 10 years and it's an exponential function. We reached the crisis in 2008 and it's been four years. I do not understand how the "sticky tape" you mentioned could prevent the catastrophe or hide it effectively. We were talking worldwide gloom and doom, weren't we?

The ongoing relevance of peak oil is that it will prevent any global economic recovery, which in turn makes it absolutely inevitable that the western world cannot escape from the debt death spiral.

That's the part I have a hard time getting my head around, the "death spiral" language.

The whole system is broken. It is now just a matter of time before this fact can no longer be hidden. We are seeing it being exposed right now in the eurozone, because the political situation there is making it impossible for the bankers and politicians to conspire to hide the fact that it is broken.

Is Greece the example of the "death spiral" you mentioned or is it the less hyperbolic "broken?" Forgive me if I have an image of a zombie apocalypse in mind.

My own guess is that the next stage of the crisis will begin at the end of this year, after the election in the US and before Christmas. This is likely to involve a widespread panic as more and more people realise that the banking system is totally pranged, and that their money is not safe in the bank. This will lead to a flight to hard assets, when all that money that has been printed in the last 4 years and is currently sitting on the balance sheets of banks and the bank accounts of the 1% suddenly starts moving. This will unleash an unstoppable wave of inflation, while at the same time the deflationary pressure on wages will be enormous. This in turn will lead to civil unrest and in some places to revolution.

Would the runaway inflation that happened in Zimbabwe be a good example?

If you want to know what happens after that, I'd recommend The Long Descent by John Greer.

Thank you. I note the title seems a mismatch with the "catastrophe" language, but I haven't read the book.

I haven't read many detailed criticisms of this picture in the thread, are these ideas pretty much accepted by the community?
 
Thank you, and thanks for the graphs. The second one, depending on the "wedge of hope" either shows the crisis happening in 2020 or sometime after the edge of the graph (after 2030). What do you think?

I'd also point out the second graph doesn't quite have the precipitous drop as the first. I couldn't make out the dates and promise to watch the video soonest.

well no, the second slide depicts actual production, past and projected. so on that one, the red wedge, and both blue channels are crude oil.

all of which are subject to the declining EROEI curve from slide 1.

so as it slides further, less and less net "profit" in terms of oil is available.

hence rapidly, and possibly exponentially (for a while anyway) rising prices as demand rises and the cost of oil (in barrels of oil) rises.

one final chart, a trading long term perspective, this is the monthly crude chart from my trading platform

crude.png


this is very bullish long term, the yellow trend line is tracking perfectly, in fact we sit right on it now, and could potentially break through powerfully imminently. (the bollinger squeeze indicator)

the larger trading channels are clear, you can see in the depths of the 2008 panic it bottomed at $30ish, but think about the state of the financial world and asset values generally at that point, clearly thats not normal action and we wont be going back there again unless we are in full crash mode.

under more normal circumstances I wouldn't expect to see crude trade much lower than the lower 2 green channels ever again.

as for the upside, to me it seems virtually unlimited. if we can hit $140 in normal peacetime, imagine what it might go to if there are supply problems or it kicks off with Iran etc.

and even without any of that I think given a year or two we will first retest that top green trendline, and eventually break through and base above. we already would have last year were it not for governmental intervention, its no mystery that they did it right at the top of the trend channel, they knew as well as we did it was about to break out.

so basically the chart seems to agree with my longer term outlook on price.
 
I haven't read many detailed criticisms of this picture in the thread, are these ideas pretty much accepted by the community?

er, not exactly, no.. :D

UE has a more extreme view than even me, I am an uberBear on the global debt sinkhole, and do think we have massive economic issues inbound, and that the next decade is going to be pretty hairy, with social unrest inevitable all over the place

IMO there's definitely going to be a global re-balancing, a long grinding descent in standard of living in the west and a corresponding ascendance in the east.

but I think we might possibly last a while yet before (too m)any large scale die offs occur.

edit. topical post on the Martenson site http://www.peakprosperity.com/blog/79590/repricing-oil

Unsurprisingly, the price of oil has been stable and has oscillated around $90 for nearly two years. A technical analyst might call this a consolidation of previous re-pricing phase, and fundamentally speaking, this is probably accurate. Recently, Ambrose Evans-Pritchard of the Telegraph newspaper marveled that oil prices could be “so high” during such difficult economic conditions:

Goldman Sachs said the (oil) industry is chronically incapable of meeting global needs. “It is only a matter of time before inventories and OPEC spare capacity become effectively exhausted, requiring higher oil prices to restrain demand,” said its oil guru David Greely. This is a remarkable state of affairs given the world economy is close to a double-dip slump right now, the latest relapse in our contained global depression...Britain, the eurozone, and parts of Eastern Europe are in outright recession. China has “hard-landed”, the result of a monetary shock and real M1 contraction last winter. The HSBC manufacturing index fell deeper into contraction in July...So we face a world where Brent crude trades at over $100 even in recession.

.....

The oil market now understands that should prices fall below $90, it starts to make sense for large integrated oil companies to simply buy oil on the open market for refining rather than spending the capital to develop the oil from the ground. The cruel math of the marginal barrel now means that prices must stay above the $90 mark to encourage investment in new supply.

Furthermore, the rate at which this new supply comes to market remains ploddingly slow. Recent forecasts, such as Leonardo Maugeri’s wildly cornucopian report, completely overstate the rate at which new supply will come to market and the rate at which existing supply is in decline.

More broadly, the public still seems not to understand that many of the giant, integrated oil companies are now mostly price-takers of oil, not price-makers of oil. ExxonMobil, Shell, and ConocoPhillips have increasingly become natural-gas-focused companies as they lost their ability to replace their own oil production with new supply over the last decade. The new oil resources which come on-stream now are made possible by the small and mid-sized oil companies, which are more nimble and more suited to the tight, narrow boundaries that define the next tranche of oil supply. Global oil supply was once composed of giant companies extracting huge volumes from singularly giant fields. Now the landscape has fractured into a million little pieces, with specialists far and wide digging up expensive, hard-to-extract oil.
 
Last edited:
Well, this thread has put a damper on my weekend. Is there a way out, or should I be telling my kids to forget about college and start learning some survival skills?
 
Looks like a good book, but I should have asked a more specific question.

As I understand it, the exponential function picture higher up in this thread is supposed to model a finite resource becoming scarcer as demand increases (exponentially) while supply fades (fixed or nearly so).

All I had in mind was to find some resource (historically) that followed this pattern. I suggested land in the early US and gold (with modern technology demands). I think there might also be an example from fisheries that have been depleted or even things like egret feathers, beaver pelts or tulip bulbs.

I'm by no means a scholar in this area and thought there ought to be existing examples if the curve was valid. I also understand that "energy" might be a different type of product -- one that has special properties and a different mechanism, but I assumed this curve would have played out elsewhere/elsewhen. Perhaps something like water in a desert area?

My ignorant suspicion is that the curve, as presented, is too simplistic to have much argumentative force.
Not ignorant, quite logical/true - you need the sources and reasons behind why it is that way (data drives the curve , the curve does not drive the data).
 
Not necessarily, no. You have to examine the specific circumstances. And in this particular case, it has to collapse catastrophically. The reasons for this are political and psychological. There is no physical or logical reason why human civilisation could not make a transition to a sustainable civilisation, without the sort of catastrophe we are talking about happening. But it would require a cultural/political/psychological revolution that no realist can believe in.
We don't even need to move to a sustainable economy, just one that's still unsustainable but on a longer timescale. And that's precisely what's happening.

Yes, but previously the pattern was either localised (and so was the collapse that followed) or the resource in question turned out to be replacable after all (e.g. whale oil being replaced by crude "rock" oil.) What is different this time is that oil can't be replaced
Wrong, of course. Oil can't be replaced without affecting the economy, but it can most certainly be replaced. And demand is elastic.

The relevant market shifts have been under way for decades, and will continue. That doesn't mean that a collapse is impossible, just that it's not inevitable.
 
<snip>
3. As technology improves the the amount of oil that can be recovered from any one oil well keeps on going up.
Only marginally, and this makes the oil cost more.
<snip>

Cannot be bothered to work out how accurate every point what you are saying is. So I picked on one I knew to be wrong. Did not take me long to find this

Another Century of Oil? Getting More from Current Reserves

They are talking about only one oil field. However this would also be true for many other fields.
In 1942, after more than four decades of modest production, the field was estimated to still hold 54 million barrels of recoverable oil, a fraction of the 278 million barrels already recovered. “In the next 44 years, it produced not 54 [million barrels] but 736 million barrels, and it had another 970 million barrels remaining,” energy guru Morris Adelman noted in 1995. But even this estimate proved wrong. In November 2007 U.S. oil giant Chevron, by then the field’s operator, announced that cumulative production had reached two billion barrels. Today Kern River still puts out nearly 80,000 barrels per day, and the state of California estimates its remaining reserves to be about 627 million barrels.

I do not think we can call this only marginal.

Yes we oil production has probably peaked and yes the price probably will go up more than down. However no one knows when oil will reach $200 (or pick your own figure). It would be next year or it might not be for another few more years.


But thanks for the detailed reply.
 
Well, this thread has put a damper on my weekend. Is there a way out, or should I be telling my kids to forget about college and start learning some survival skills?

They should forget about college unless the thing they are going to learn is actually going to be useful in a collapsing world.

As for survival skills...my "job" is teaching people about wild food (especially fungi.)
 
Cannot be bothered to work out how accurate every point what you are saying is. So I picked on one I knew to be wrong. Did not take me long to find this

Another Century of Oil? Getting More from Current Reserves

They are talking about only one oil field. However this would also be true for many other fields.

I do not think we can call this only marginal.

OK...I could get into a long, detailed discussion about why I'm not wrong, but I sense you aren't really up for it. Google for Cantarell Oil Field if you want to find out what really happens as technology for recovering oil improves.

Yes we oil production has probably peaked and yes the price probably will go up more than down. However no one knows when oil will reach $200 (or pick your own figure). It would be next year or it might not be for another few more years.

Predicting prices is impossible, because it depends on unpredictable factors like how deep the depression eventually hits China, how much fiat money is printed, how high general inflation is running, how much production gets taken out of the free market and used instead in bilateral deals, etc...

Predicting oil and gold price movements is kev's game. Personally I'm more interested in the future of humanity and the fate of industrialised civilisation.
 
Last edited:
Well, this thread has put a damper on my weekend. Is there a way out, or should I be telling my kids to forget about college and start learning some survival skills?

if you're serious, invest a little time on the Martenson Crash Course.

you will do one of two things:

1) broadly agree, and start thinking seriously about how you can be ahead of the curve.

2) disagree, go off and research to try and prove your thoughts as correct.

which will lead either to:

3) realizing you are incorrect - goto 1.

4) realizing you are correct and sleeping better at night.

the only way you could possibly really regret anything is to not check it out properly and come to your own conclusions.

I will have a son soon (6 weeks time) and it will be being taught the appropriate life and survival skills just as soon as it can move and speak.

(it only becomes "him" upon life skills graduation exam age 6. until then it gets the coffee and does as it's told.)
 
Predicting prices is impossible, because it depends on unpredictable factors like how deep the depression eventually hits China, how much fiat money is printed, how high general inflation is running, how much production gets taken out of the free market and used instead in bilateral deals, etc...

Predicting oil and gold price movements is kev's game. Personally I'm more interested in the future of humanity and the fate of industrialised civilisation.

its not impossible, but its not easy to do with consistency of profits.

probably the most mathematically thorough analyst I follow, Reggie Middleton is suggesting / predicting a continuation of the 2009 path here

http://boombustblog.com/blog/item/6168-does-paper-oil-destroy-fundamental-market-pricing?-weigh-in

but as we know, that is major collapse territory, and I don't think we'll see a collapse without a tsunami of printing at least one last time
 
Well, just doing the math, it doubles every 10 years and it's an exponential function. We reached the crisis in 2008 and it's been four years. I do not understand how the "sticky tape" you mentioned could prevent the catastrophe or hide it effectively. We were talking worldwide gloom and doom, weren't we?

It has prevented the system from "fast crashing". So far.

That's the part I have a hard time getting my head around, the "death spiral" language.

The debts can't be paid off. It is impossible. The "death spiral" language comes about because the powers that be are trying to escape from a debt trap by issuing more and more debt. You can't solve a debt problem by creating more debt. So we hear about "austerity" instead as a way out of the crisis, but this doesn't work either because it kills off any chance of the economic growth required to have any hope of paying off the debts. Thus it is a death spiral.

Is Greece the example of the "death spiral" you mentioned or is it the less hyperbolic "broken?" Forgive me if I have an image of a zombie apocalypse in mind.

Greece is broken. In any normal circumstances, Greece would have defaulted/devalued a long time ago. The problem is that where Greece goes, so Spain and Italy will inevitably follow, and when you take into account the fact that a full Greek default will be by far the biggest sovereign default in history, then you might get some idea at how serious a Spanish default is going to be. So instead of being allowed to default and start again, Greece has been turned into a zombie nation. There is no way out for Greece. As long as it stays in the Euro with Germany, and as long as it bears an unpayable load of debt, there is no light at the end of the tunnel. For Greece, "zombie apocalypse" is painfully appropriate.

Would the runaway inflation that happened in Zimbabwe be a good example?

Maybe, but probably not. The situation in Zimbabwe only got into the insane state that it did because Zimbabwe was/is being run by a psychopathic lunatic who has absolute power. In Europe, or in the US, there would be major political changes, driven by an extremely unhappy "99%", long before the whole western world turned into the monetary equivalent of Zimbabwe.

Absolute inflation rates aren't really the main issue. The relationship between wage inflation and food/fuel inflation is more important. Which would you prefer...inflation of everything, including your wages, running at 100% per year, or inflation of food, fuel and other necessities running at 20% while your wages go nowhere?

Thank you. I note the title seems a mismatch with the "catastrophe" language, but I haven't read the book.

Yes and no. Greer is saying that we aren't going to face some non-supernatural catastrophe that is nevertheless on the scale of the supernatural "end times". He's arguing against a "fast crash" of the population. He claims this is derived from mythology, as is the myth of never-ending progress. However, he is also saying that over a period of a few hundred years, we are heading back to an agrarian way of life and a much smaller population.

I don't necessarily agree with Greer on everything, but his book is a useful starting point for a person who isn't familiar with the intricacies of this topic. I think Greer's book may also be slightly out of date already, which is a sign of how fast things are changing. Speaking as somebody who has been warning people about this for the last ten years, current world events are more than a little bit fascinating. We are now actually getting a better idea of exactly how things are going to play out. The powers that be are losing control of the situation, and the story. They are turning on each other. The truth is being exposed, bit by bit. LIBOR rigging is now conspiracy fact instead of conspiracy theory. Just wait till it also becomes known that the gold and silver markets have been manipulated in a major way, and that a lot of people who thought they had invested in physical metal will discover they have actually invested in a worthless piece of paper that was supposed to go up and down in value along with the real metal. Brown stuff hits rotating air-shifter.

 
Last edited:
and a bonus one for you.

[qimg]http://www.internationalskeptics.com/forums/imagehosting/17852504a2c2cf0a92.png[/qimg]

blue at the bottom is cheap and easy oil fading away. my favourite bit is the red, "the wedge of hope" - fields we *think* we are going to find.

Re-reading this thread, I think this needs some clarification (not for you, but for others who might misunderstand.) If you dig down, the origin of the red wedge had nothing to do without anyone ever thought we were going to find. It was/is what we need to find in order to stop the economic model they were using from breaking. There was no input from any geologists or other people who had any accurate information about what we might think we can find. Oil geologists aren't in the business of hoping. Hoping is for politicians and economists.
 
Last edited:
marplots said:
Looks like a good book, but I should have asked a more specific question.

As I understand it, the exponential function picture higher up in this thread is supposed to model a finite resource becoming scarcer as demand increases (exponentially) while supply fades (fixed or nearly so).

All I had in mind was to find some resource (historically) that followed this pattern. I suggested land in the early US and gold (with modern technology demands). I think there might also be an example from fisheries that have been depleted or even things like egret feathers, beaver pelts or tulip bulbs.

I'm by no means a scholar in this area and thought there ought to be existing examples if the curve was valid. I also understand that "energy" might be a different type of product -- one that has special properties and a different mechanism, but I assumed this curve would have played out elsewhere/elsewhen. Perhaps something like water in a desert area?

My ignorant suspicion is that the curve, as presented, is too simplistic to have much argumentative force.

fuelair said:
Not ignorant, quite logical/true - you need the sources and reasons behind why it is that way (data drives the curve , the curve does not drive the data).

on reading fuelair's reply to this I realize you are both misunderstanding the original slide / curve I posted and apologies I missed this 1st time.

the EROEI curve is simply a mathematical function of plotting the energy out/energy in, and that curve will apply to anything.

it is a relatively simple process to then put dates on it for oil production and see that at an EROEI of around 3ish for the latest discoveries that are going to "save us"..

..well put it this way, my workhorse car runs on Vegoil, (and that thread was largely a pre-run of this thread, but from March 2012) which myself and a friend (still, mostly) get for free, and re-cycle.

I no longer "need" crude oil for personal local transport, (unless I want to cross the big moat and get off my island)

of course much food that comes here does..
 
Last edited:

ISF - Join now!

Every member here is approved by hand. No bots, no spam, just people who care about evidence and honest debate.

Membership is free!

Create your free account

Back
Top Bottom