Moderated Iron sun with Aether batteries...

Status
Not open for further replies.
And as a bit of a graphics expert myself,

Right. I'm just supposed to take your word on that eh?

I'm calling fraud. I think you've twiddled with a couple filters in PhotoShop to get something you think looks like running difference images.

Are you claiming that Photosphop is incapable of producing a "real" running difference image, yes or no?

I say you don't know what you're doing and you've faked it.

Ya, and I'm going to make you demonstrate that in court one day or pay dearly for your lies.
 
Getting pretty close to done making those videos, Michael? :p

Nope. I'm not your monkey on command. I'll produce a bunch of them for you when I'm ready. I may even do a few in Photoshop as well so I can stuff that BS down your throat too. Photoshop offers FITS file extensions, it's fully capable of adding intensity to an image and/or subtracting one image from another. You're full of it.
 
Liar. Where's the paper? Nothing I ever presented anywhere on any forum supports your claim.


What you mean is nothing you ever presented anywhere on any forum supports your claim.

And obviously you've got lots of spare time on your hands. Certainly you've got those videos ready by now. :D

Anyone want to bet a $5 bill that Michael will employ every possible evasion and stall tactic he can to avoid ever actually demonstrating that he is qualified to understand running difference imagery?
 
Nope. I'm not your monkey on command. I'll produce a bunch of them for you when I'm ready. I may even do a few in Photoshop as well so I can stuff that BS down your throat too. Photoshop offers FITS file extensions, it's fully capable of adding intensity to an image and/or subtracting one image from another. You're full of it.


Just quoting this tantrum for the record. :)
 
And obviously you've got lots of spare time on your hands. Certainly you've got those videos ready by now. :D

FYI, I am the only one of the two of us to actually post a "real" running difference solar image. You may not like the four I've given you, but at least I've been man enough to post them for all the world to see and for idiots like you to bitch about. Where's your video for us to inspect, and how do I know that you personally created them? What software package(s) did you use?
 
He never addresses the simple physics that the TRACE instrument in the 171A pass band can only see light from plasma at > 160,000 K.

You dont seem to understand the 171 pass band light reflects just like white light. You can see reflections from the structures using the 171A light.

You dont seem to understand that the 171 light comes from the flares and the loop footprints.

The surrounding surface is solid iron.

Again. Think of a cathode in a plasma process. The whole cathode is not molten. Only spots where there is a discharge happening.
If you use this model this will get you part of the way to what my model says.

The graph I posted shows that 171 light from loops and footprints goes right through the photosphere. This means TRACE can see under the photosphere.

That does not mean that the surface is MKK(multi kilo Kelvin) hot. Only that the light at 171A(72eV) goes right through the photosphere, especially if its high intensity like loop foot prints.
The photosphere is THIN.

More tonite.
 
FYI, I am the only one of the two of us to actually post a "real" running difference solar image. You may not like the four I've given you, but at least I've been man enough to post them for all the world to see and for idiots like you to bitch about. Where's your video for us to inspect, and how do I know that you personally created them? What software package(s) did you use?


I already told you, twice, how you'll know that my running difference videos are the same thing as posted by LMSAL and NASA. For one thing, Dr. Hurlburt from LMSAL was kind enough to discuss the issue with me personally, so I know what they do there. And for another, if you actually know what you're talking about (and there's no evidence of any kind yet that you do), you'll know by my explanation of my process, which I've already given dozens of times over a half a decade, and you'll know by looking at them.

Honestly, do you have some kind of reading comprehension problem? If I need to take my vocabulary down to say, a third grade kid's level for you to understand I will, but you're going to have to help me out.

Oh, and you do have those videos processing, don't you? :p

Another tantrum coming, perhaps?
 
Well, sure I could map it if I wanted to map a highly volcanic surface that's constantly changing over time. It's not all the productive in my experience.

I have in fact compared RD image surface features in SOHO images over a full rotation cycle (27.3 days) but even then there are obvious and sometimes significant changes over that timeline, particularly during active phases where the volcanic activity is constant and occurs all along the surface.

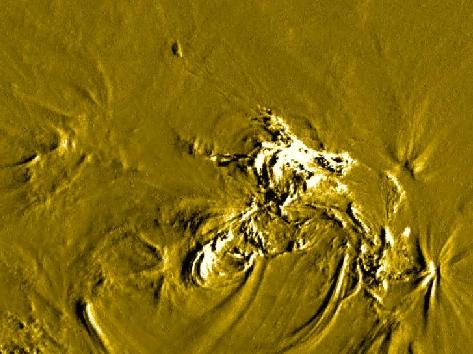
If you look closely at the gold RD LMSAL image, you'll actually see surface erosion along the bottom right hand side just after the main event due to the electrical processes that create the coronal loops. It literally "peals" particles from the surface and ionizes them in the loop. That electrical erosion process shows up in the RD images too, as you can see from the video. There are changes to the surface that occur for a variety of reasons, so any surface "maps" would need to be constantly updated.

How does a surface so volcanically active that it completely recreates itself on the scale of weeks to months ever have time to solidify?

And how can you see a solid surface in RD images, when the whole point of RD is to filter out the unchanging parts?
 
You don't seem to understand. There are no structures for anything to reflect from.

171surfaceshotsmall.JPG


Ya, except for all the structures in the image.
 
How does a surface so volcanically active that it completely recreates itself on the scale of weeks to months ever have time to solidify?

It may not. Some parts probably never do. Some parts do however and those parts are a lot more 'persistent' timeline wise than any sort of plasma. The structures of the photosphere tend to come and go in roughly eight minutes or so. They don't show longevity over days and weeks like that. Even closeup images of sunspots show significant change around the edges of the penumbra of the sunspot during the image, regardless of the time frame we're talking about. Plasma simply isn't "rigid' and doesn't have properties necessary to explain these images.

And how can you see a solid surface in RD images, when the whole point of RD is to filter out the unchanging parts?

Due to the motion of the sun between the two images that are used to create the RD image, and the fact the first image is modified in intensity before the second one is subtracted, it doesn't actually 'filter out' the unchanging parts as you might think.

The process "sort of" filters out some of the coronal loop activity itself, but the RD process reveals the overall outline of emission patterns. "Longevity" then depends on whether those emission patterns remain stable and consistent in their basic outline or they don't, not to mention the structures they reflect off of. Only if the light emissions remain consistent will the images remain consistent. If you were to do a RD image from a close-up GBAND image of the photosphere, you'd see all sorts of movements due to the movements of the structures in the original images. As long as the overall light/dark patterns are visually moving in the original images, you'll see that same movement play out in the RD images too. The iron ion wavelengths however show very consistent emission patterns from one frame to the next. That's why the RD images show persistent structures over time.

The overall surface terrain dictates the basic emission pattern. The rigidness of the light source demonstrate that something under the photosphere is much more rigid than the mobile plasma of the photosphere.
 
If that's RD, those are exactly the opposite of structures. They're changes.

It's not actually that simple as I explained in my previous response. Keep in mind that the sun rotates between the two images and the two images are usually 10-30 minutes apart. The sun rotates left to right in that video, but the video was 'cropped" to keep the image centered. That rotation between images creates those "shadows" on the left side of various items in the image and "bright areas" to the right.
 
[qimg]http://www.thesurfaceofthesun.com/images/171surfaceshotsmall.JPG[/qimg]

Ya, except for all the structures in the image.


And of course so far you've refused to demonstrate that you understand the construction and meaning of running difference images. Your claim is in contradiction to the position of the people and organization who designed and built the satellite, launched it, acquired the data from it, processed that data, analyzed the results, and explained to me personally how it works. So your comment here is wholly unsupported.

But I do imagine you're pretty close to ready to post those videos and clear up this whole mess you're making. :p
 
It may not. Some parts probably never do. Some parts do however and those parts are a lot more 'persistent' timeline wise than any sort of plasma. The structures of the photosphere tend to come and go in roughly eight minutes or so. They don't show longevity over days and weeks like that. Even closeup images of sunspots show significant change around the edges of the penumbra of the sunspot during the image, regardless of the time frame we're talking about. Plasma simply isn't "rigid' and doesn't have properties necessary to explain these images.


Due to the motion of the sun between the two images that are used to create the RD image, and the fact the first image is modified in intensity before the second one is subtracted, it doesn't actually 'filter out' the unchanging parts as you might think.

The process "sort of" filters out some of the coronal loop activity itself, but the RD process reveals the overall outline of emission patterns. "Longevity" then depends on whether those emission patterns remain stable and consistent in their basic outline or they don't, not to mention the structures they reflect off of. Only if the light emissions remain consistent will the images remain consistent. If you were to do a RD image from a close-up GBAND image of the photosphere, you'd see all sorts of movements due to the movements of the structures in the original images. As long as the overall light/dark patterns are visually moving in the original images, you'll see that same movement play out in the RD images too. The iron ion wavelengths however show very consistent emission patterns from one frame to the next. That's why the RD images show persistent structures over time.

The overall surface terrain dictates the basic emission pattern. The rigidness of the light source demonstrate that something under the photosphere is much more rigid than the mobile plasma of the photosphere.


You do not know what you're talking about.
 
The Transition Region

Transition Region and Coronal Explorer. What has that got to do with the temperature profile of the photosphere, which is derived from Earth based observations?
The point Tim is that they *ASSUMED* before they took their first picture of the sun that there was some magical upper atmospheric "region" where a "transition" occurred in the plasma as though it were some layer far above the photosphere, somewhere between the lower corona/upper chromosphere. They *ASSUMED* a location Tim.
Really? Assumed? Well, let's test that hypothesis. The TRACE mission launched from Vandenberg AFB in April 1998. So, what was known about the transition region before the spacecraft launched? Was it all just some simple "assumption", or were there valid physical reasons for expecting a transition region between the chromosphere and corona?

Exhibit 1
Solar XUV Limb Brightening Observations II: Lines Formed in the Chromospheric-Coronal Transition Region; George Withbroe, Solar Physics 11(2): 208-221, February 1970
Abstract: Limb brightening of XUV lines of the ions CIII NIII, NIV, OIII, OIV, OV and SiIV is compared with that predicted by a modified version of a coronal model developed by Dupree and Goldberg. Systematic differences between the predicted and observed limb brightening are found. These differences can be eliminated by introducing into the model the effects of spicules that extend up into the chromospheric-coronal transition region. The spicules are assumed to be opaque to radiation between 500 and 900 Å because of absorption in the hydrogen Lyman continuum.

Exhibit 2
Ultraviolet Studies of the Solar Atmosphere; Robert Noyes, Annual Review of Astronomy and Astrophysics 9: 209-236, 1971
No abstract, but a lengthy introduction. This paper concentrates on the transition region and explicitly shows the temperature profile of same in the very first figure of the paper, on page 210.
Quoting from page 223, under the heading "The Transition Zone": The transition region between the 104K chromosphere and the 106K corona is perhaps the most intriguing region of the observable solar atmosphere. It has become clear in recent years that this transition region is almost incredibly thin - the temperature rise from 105 to 2x10⁵K, for example, appears to take place over a distance of only about 20 km (see, e.g., Athay 1971). This sharp transition region immediately overlies the upper chromosphere, where large scale velocities are observed up to several times the chromospheric sound velocity, where vertical displacement of chromospheric material reaches 10,000 km in spicules, and where the influence of magnetic fields is suggested by the channeled flow of spicules (For a review of spicules and other dynamic phenomena in the upper chromosphere, see Beckers 1968). The steepness of the transition zone was already evident by the time of Goldberg's (1967) review, and we only summarize the main evidence here, referring the reader to that discussion and to Athay's recent review (1971) for details.

Exhibit 3
The Solar Chromosphere and Its Transition to the Corona; H. Frisch, Space Science Reviews 13(3): 455-483, July 1972
Abstract: Our present knowledge on the average physical properties of the chromosphere and of the transition region between chromosphere and corona is reviewed. It is recalled that shock wave dissipation is responsible for the high temperatures observed in the chromosphere and corona and that, due to the non-linear character of the dissipation mechanism, no satisfactory explanation of the structure of the outer solar layers has yet been given. In this paper, the main emphasis is on the observations and their interpretation. Evidence for the non-spherically symmetric structure of the atmosphere is given; the validity of interpreting the observations with the help of a fictitious spherically symmetric atmosphere is discussed. The chromosphere and the transition region are studied separately: for each region, the energy balance is considered and recent homogeneous models derived from ultra-violet, infrared and radio observations are discussed. It is stressed that although in the chromosphere, a study of the radiative losses may lead to the determination, as function of height, of the amount of mechanical energy dissipated as function of height, a more detailed analysis of the velocity field is necessary to find the periods and the wavelengths of the waves responsible for the heating. The methods used for wave detection and some results are presented. Observational and theoretical evidence is given for the non-validity of the assumption of hydrostatic equilibrium which is commonly used in modeling the transition region. We conclude that a better understanding of the heating mechanism will come through a higher spatial resolution (less than 0.2″) and more accurate absolute measurements, rather than from sophisticated hydrodynamical calculations.

Exhibit 4
Temperature Structure and Conductive Flux in the Chromosphere-Corona Transition Region; G. Elwert & P.K. Raju, Solar Physics
25(2): 319-328, August 1972
Abstract: Observations of UV-line intensities referring to the whole undisturbed Sun are used to investigate the chromosphere-corona transition region. For the evaluation of the integral representing the theoretical line intensities it appears to be an improvement to consider not the temperature gradient but the conductive flux to be nearly constant in the line-forming region. The variation of conductive flux with temperature calculated in this way is indeed small. Moreover, in the conductive flux versus temperature diagram the scatter of points is found to be less with coronal values of relative abundances than with photospheric ones. The results are used for determining the temperature structure of the transition region.

I submit the above exhibits, and the citations thereto, into evidence as a refutation of the unsubstantiated allegation that the location of the transition region was simply "assumed" prior to the launch of the TRACE mission. As the material given here shows, along with the full content of the referenced papers, the physics & location of the transition region was well developed more than 20 years before the launch of the TRACE mission. Rather than simply "assuming" a location for the transition region, scientists in fact had solid physical evidence, based on direct observations of the sun, that there was a transition region between the chromosphere and corona. Indeed, they had already derived not only the location of the transition region, but had already determined a temperature profile for it. I assert that the claim made by Mozina that this was all only "assumed" stands refuted.

What they "observed" doesn't fit that model, not even slightly.
This unsubstantiated claim is itself not at all consistent with the published track record of the TRACE mission, as well as other transition region studies.

Example (abstract only)
A new view of the solar outer atmosphere by the Transition Region and Coronal Explorer; C.J. Schrijver, et al., Solar Physics 187(2): 261-302, July 1999
Abstract: The Transition Region and Coronal Explorer (TRACE) described in the companion paper by Handy et al. (1999) provides an unprecedented view of the solar outer atmosphere. In this overview, we discuss the initial impressions gained from, and interpretations of, the first million images taken with TRACE. We address, among other topics, the fine structure of the corona, the larger-scale thermal trends, the evolution of the corona over quiet and active regions, the high incidence of chromospheric material dynamically embedded in the coronal environment, the dynamics and structure of the conductively dominated transition region between chromosphere and corona, loop oscillations and flows, and sunspot coronal loops. With TRACE we observe a corona that is extremely dynamic and full of flows and wave phenomena, in which loops evolve rapidly in temperature, with associated changes in density. This dynamic nature points to a high degree of spatio-temporal variability even under conditions that traditionally have been referred to as quiescent. This variability requires that coronal heating can turn on and off on a time scale of minutes or less along field-line bundles with cross sections at or below the instrumental resolution of 700 km. Loops seen at 171 Å (~1 MK) appear to meander through the coronal volume, but it is unclear whether this is caused by the evolution of the field or by the weaving of the heating through the coronal volume, shifting around for periods of up to a few tens of minutes and lighting up subsequent field lines. We discuss evidence that the heating occurs predominantly within the first 10 to 20 Mm from the loop footpoints. This causes the inner parts of active-region coronae to have a higher average temperature than the outer domains.

This first major review of results from the new TRACE spacecraft (launched April 1998) shows no sign of incompatibility or inconsistency with earlier studies of the transition region. One would think that, had the TRACE scientists seen that their data were not consistent with the very detailed knowledge of the transition region that has already been developed (see above), they would likely have mentioned it somewhere along the line. Or perhaps you will now claim a conspiracy to hide the transition region truth?

In fact the 171A footprints *DO NOT* originate in some mythical "transition region" above the photosphere as they *ASSUMED* before launch, but actually they originate *UNDER* the photosphere. They've never abandoned their flawed assumption even though the images blow their "transition region" theory out of the water. The loops span the whole atmosphere Tim, from the "surface" far below the photosphere, to way into the corona. They aren't limited to a singular magical "transition region", they are ordinary discharges occurring throughout the whole atmosphere.

The certainly originate below the photosphere Tim as I was attempting to demonstrate to you with that white light image.
Well, the white light images and the TRACE 171Å images do not show the same physical material. You are seriously misinterpreting the images, to the point of being quite silly about it really.

To begin with, the "footpoint" of the loop is defined to be where the loop intersects the photosphere, so you lose that one to the dictionary. Of course, we already know that the magnetic fields around sunspots and active regions penetrate deeply into the photosphere, so if that is a point you are trying to make, then you are working hard to convince people of something that everybody already knows. But if you are trying to argue that the 171Å emission comes from below the photosphere, you have failed rather miserably to do so. I point out that you have never been able to produce a single image that unambiguously supports your claim. What you are seeing is loops that penetrate the top of the chromosphere, and then assuming that they are in fact penetrating the photosphere.

So we come full circle. You claimed that the location of the transition region was a mere "assumption" prior to the launch of TRACE, but I have demonstrated that this is a false claim. In reality, you are the one doing the assuming around here, and with no physical justification at all. The only "justification" you can claim is your arbitrary, subjective and biased interpretation of the images you have. But since your claims very clearly violate the laws of physics, that trumps your wimpy images every time.
 
How does a surface so volcanically active that it completely recreates itself on the scale of weeks to months ever have time to solidify?

And how can you see a solid surface in RD images, when the whole point of RD is to filter out the unchanging parts?

I explained that part earlier on in the thread.
Coronal rain.


RD images show changes in light. They have to. How else you going to see what is going on?

So if the light is is changing and reflecting off of something that is not moving, thats what you would see. This thing that is not moving is also clearly higher than the surrounding terrain.

Not only that but the flare lifts off from the top of this thing that is not moving and is higher than the surrounding terrain. But while the flare lifts off from the top of aforementioned thing, it does not take part of the thing with it, which is what I would expect with a plasma. The thing doesnt even change shape from the impulse of the flare lifting off.
Solid. The flare lifting off is the top of a iron mountain heating up into into a plasma.
 
The flare lifting off is the top of a iron mountain heating up into into a plasma.

Hey brantc, did you try the experiment I suggested? Can you keep an icecube inside a turkey from melting when the turkey is put in a hot oven for a few hours? How about for a few days? How about for 4.7 billion years? Can you keep the ice cube inside a turkey from melting while it's inside a hot oven for 4.7 billion years?

Because that's basically what you're claiming is going on with the sun.
 
To begin with, the "footpoint" of the loop is defined to be where the loop intersects the photosphere, so you lose that one to the dictionary.

Yes, that may be the definition but is that where they really are?
It doesnt matter how they are defined. They just changed Pluto from a planet to something else but it is still where it is..

Of course, we already know that the magnetic fields around sunspots and active regions penetrate deeply into the photosphere, so if that is a point you are trying to make, then you are working hard to convince people of something that everybody already knows. But if you are trying to argue that the 171Å emission comes from below the photosphere, you have failed rather miserably to do so. I point out that you have never been able to produce a single image that unambiguously supports your claim. What you are seeing is loops that penetrate the top of the chromosphere, and then assuming that they are in fact penetrating the photosphere.

I think that all of the papers that you posted are based on
Bilderberg continuum atmosphere from the 50's.

"The Bilderberg Continuum Atmosphere fails to reproduce the observed limb-darkening throughout the range of wavelengths 4500 Å< λ < 25 000 Å. The temperature-pressure diagram for the deep layers of this model is a curve which is flatter than the relation predicted from the mixing length theory. A modification of the Bilderberg Continuum Atmosphere that improves representation of the observations and theoretical results is proposed."
http://articles.adsabs.harvard.edu/cgi-bin/nph-iarticle_query?1968SoPh....3..106E&classic=YES

Its been modified many times since then but never any real predictions. We have better satellites now.
The emission regions originally appear to be based on temperature assumptions for a fusion model.
FeIV is really hot so its where its really hot. But they are confusing the iron emission in the corona with the loop footprints.
I would expect that there is a layer of iron atoms but how did those atoms get there?? Especially when there is an enrichment of up to 5 times.
That does not give you the source of the iron emissions!!!

Solar surface. Loop footprints 1500?km below the photosphere.
http://trace.lmsal.com/POD/images/T171_000719_123108.gif
http://trace.lmsal.com/POD/images/T171_000828_170708.gif

This one you can see the formations under the loops that result from coronal rain.
http://trace.lmsal.com/POD/images/arcade_9_nov_2000.gif

This view spicules are more apparent.
http://trace.lmsal.com/POD/images/T171_980819_0604.gif

There is no question that 171 penetrates the thin photosphere, that the layer that is luminescent, and is only a few hundred miles thick.

So in reality every assumption that went into building TRACE is based on a solar "model". Do you think they designed the cameras to to overexpose on purpose?? Those people are great engineers but if they are confined by theorists then that whats you get.

All they have to do is switch the top image to the bottom.
http://trace.lmsal.com/POD/images/McAteer_etal_2003_stackplot.jpg
 
Hey brantc, did you try the experiment I suggested? Can you keep an icecube inside a turkey from melting when the turkey is put in a hot oven for a few hours? How about for a few days? How about for 4.7 billion years? Can you keep the ice cube inside a turkey from melting while it's inside a hot oven for 4.7 billion years?

Because that's basically what you're claiming is going on with the sun.

If had a really big ice cube and a really thin turkey I think I could keep it from melting for at least 6 billion years.

Your claim would be valid using your understanding of the solar structure.
 
If had a really big ice cube and a really thin turkey I think I could keep it from melting for at least 6 billion years.

You'd be wrong. Crunch the numbers, brantc. Find out the heat capacity and the latent heat of solidification for iron. Find out the radiative power incident on this solid surface. Calculate how long it would take for all of it to melt. Is it 6 billion years? Or is it something considerably shorter?

If you can't figure out how to do something so basic, I can help, just admit you're helpless.

Your claim would be valid using your understanding of the solar structure.

My claim would be valid using my understanding of basic thermodynamics. And I'm applying that understanding to your model of the sun, not mine. If you think thermodynamics is wrong, just say so.
 
hiliting mine.


Could it be that you simply don't understand his answers?

IMO this was the best question of the day. I'm sorry I didn't get to it earlier, but before I go to dinner with my wife I'd like to respond.

IMO the problem was that I actually "agreed" with several aspects of his 'explanation'. For instance, there are persistent EM fields present in these areas, primarily due to the persist discharge patterns that form along the surface. I couldn't help but actually agree that magnetic field patterns were: A) present, B) formed persistent pattern. It ultimately came down to *WHY* these emission and reflection and EM patterns were persistent.

IMO the problem was that I ended up agreeing with too many aspects of his "explanation", but they all lead back to why those *ELECTRO*magnetic fields are stationary, and IMO his answer was vague at best, and inadequate IMO particularly considering the angular aspects of the persistent features and their interaction with the wave, the seems to put them *UNDER* the wave at some depth.

Parts of the 'explanation' didn't jive with the sunspot data, or there was insufficient sunspot images that day on the SOHO servers for me to verify the sunspot aspect of his statements. The outline however is not consistent with the images I could get from the SOHO archives, nor are they "mobile" around the edges of a full umbra the way we would expect if that were some 'surface' feature related to a sunspot. Many of his statements made total sense from my perspective however, but ultimately it comes right back to the concept of "persistence" and "stability" of that "structure". It is located under the wave based on the way the outline interacts with the wave. It's not an impediment to the wave itself, so it's not likely to even be a surface related feature. The "technique" itself that allows us to observe that wave on the surface also allows us to look under and through the surface of the photosphere, and thereby reveal the wave.

The overall persistence and angular structures of these ELECTROmagnetic discharge patterns directly relate to the "surface features" from where they originate, which is by the way *FAR* below the surface of the photosphere in the 171A and 195A wavelengths.

I'm headed out to dinner and a date with my wife. Enjoy your weekend too. :)


And I'm sure you'll be getting around to processing those running difference videos when you get back. Oh, wait. I'm sure you're going to leave it exactly where you've left it for five-plus years now, bold assertions, lies, running your mouth, and absolutely not a mote of effort invested into showing that you're actually qualified to speak on the issue of solar physics.

So much for the time I've spent making the videos I made, eh?
 
...

You personally rely on personal insults and ad homs more than anyone I've ever met in cyberspace. It's like talking to a parrot that was owed by a sailor. If you keep calling me fraud, you best be prepared to back that up in court.
Speaking of parrots. Sir Kettle...:rolleyes:

You have, BY YOUR OWN CHOICE, made yourself a public figure (and laughingstock) with your web page and your promiscuous trollish postings all over the Internet, so I believe you are S.O.L.

Besides, you came here and left the starting gate insulting and maligning the motives and Honor of every Physicist that did not agree with your crankitude. You were deliberately provocative with your demeaning words in every single post, and then ran tattling to teacher when even the mildest slurs were directed at your precious crackpottery.

You have earned every bit of derision and disrespect you receive, because of your own behavior.

Now you have the CHEEK to threaten legal action? A word comes to mind for your behavior, but propriety and this forum's rules preclude me from typing it.

But I can offer one: CHUTZPAH!

This is a complete and absolute lie on your part. Period. FYI it makes no damn difference how they were created or what software package was used to create them. They would not be "fake" or "frauds" unless someone specifically changed the original images or used a different technique on them, and no such thing was done to the images I cited. You're pushing your luck dude. Keep in mind that your public comments on this website are something you can be held liable for, including charges of fraud. You're crossing important legal lines now.
IMHO, the fraud lies in what you claim is IN those images, and the Victims are the poor souls who are gullible enough to believe your whale dreck.

...

Aside: Here's where I predict Michael will throw another tantrum. He'll blame me for his inability do demonstrate hs qualifications. He'll whine and complain because I know this stuff and he doesn't. He'll whine and cry and badmouth me for treating him badly when all I really am doing is challenging his claim.

Here's where he could take advantage of a beautiful opportunity to explain every last pixel in a running difference image, explain how any process can be applied to a couple of images of data gathered thousands of kilometers above the photosphere, and somehow show surface features below the photosphere.

Keep in mind that Michael's crazy notion would be like taking a couple of weather satellite photos of a completely cloud covered city, running them through some sort of computer program, and having the results show the streets of the city. Only his nutty conjecture would be unimaginably more difficult because there is vastly more opaque material to see through and several thousand more kilometers of distance to account for in the running difference graphs made from solar satellite images.​
Worthy of repeating!

Kosovichev's own explanation should suffice, yes? He says they aren't rigid features nor are they under the "wave". Why should we believe you and not him?

Michael, honestly, truthfully, and to the best of not only my knowledge but to the best of the knowledge of every last professional physicist on the face of this planet including Dr. Kosovichev, there is no rigid element under the wave.

Like I said, I could certainly venture an opinion based on a half a decade worth of evidence as to why you believe you see something solid there. But it would only piss you off. And I'm sure I'm not the only one here who would rather see you stop throwing tantrums and start trying to support your crackpot notion about the Sun.

And just so we don't forget, your qualifications to analyze and/or explain running difference images has been challenged, and so far you have outright refused to support your claim of being qualified.
Worth repeating, also.

Why? Are you appealing to authority perhaps?

You should believe me because he offered us no relevant way to explain the rigid outlines in the video, just as nobody here will offer us a relevant way to explain those features using a plasma sun model.
Says the crank who "refuse to bark math on command", and has never demonstrated ANY understanding of the fundamentals of even mid-level physics.

(Michael likes to fancy himself as the Lone Crusader for Truth, standing solitary against the Vast Physics Conspiracy):rolleyes:

Well, the problem is that none of you account for that rigid outline under the wave. To his credit Dr. Kosovichev spent many emails with me trying to do so, but he ultimately didn't offer us a physically viable method to explain it. You won't do that either.
Typical crankish tactic: Send E-mail or letters to any moderately accomplished expert they can locate, and if they respond, badger them mercilessly to get them to agree with the crackpottery, and then interpret their failure to give you an agreeable reply (or if they give up in disgust, just to get some peace) as "You see, I have the answer and this poor scientist can't prove me wrong!".

It is a truly sad drama, that unfortunately plays out every day, in every university and research facility.:(

I don't even know what makes you think that *YOU* are qualified to explain a solar RD image. So far all you've done is talk about the technique mathematically and you have outright ignored the solar processes and the specific pixels in specific images. What exactly are your qualifications as it relates to solar physics? I accept that you understand the math related to RD image processing but I see no evidence at all that you know squat about solar physics or solar images in general.
And yet, you won't take the word of even the qualified scientists that you molest, because they disagree with your speculations -- and of course you have ALL the right answers.:rolleyes:

But that expertise is only meaningful if he can offer us an explanation for the rigid aspects of the image. If not, his "expertise" is limited in that aspect and we still need a valid explanation for those rigid outlines in the image. That is essentially where things sit.
He never has claimed (as far as I have seen) to be a photo interpreter of solar, limited-passband satellite images. What he has claimed is to thoroughly understand Running Difference (subtraction) processing, and what one can expect the resulting sequence to represent: something you never did until he told you.

Explaining the final interpretation of the features revealed may require a different set of skills that someone else can provide.

I once worked for a Top-Notch Radiologist who relied upon his equally experienced Chief Radiologic Technologist to give him the quality images he needed to allow the correct diagnosis. For certain sophisticated circulation studies, he would set up a Rapid Film Changer (capable of several very brief exposures per second on <roughly> 12"X14" rolled high-res X-ray film), tied in to the trigger circuit of the X-ray generator, along with a sophisticated Viamonte-Hobbes contrast media injector, set to delay start of the "shot" until the first "reference frame" was exposed. After the patient was prepped and the catheter inserted, the procedure would be started and be finished in a few seconds.

The Chief would then retire to the darkroom, and sometime later emerge with a stack of time-sequenced, super-subtraction Images (each subtraction pair hand-registered and contact flashed) showing the circulatory system as the Contrast progressed through, with mere shadows remaining where bone and other structures had previously obstructed the view.

My POINT here is that the Radiologist was the one who did the interpretation, but the Chief produced the images for him to "read". Neither tried to do more than his specialty education prepared him for, but each fully understood the Techniques, requirements, and limitations of the other.

As far as you have shown, you possess none of the skills for either generating the images or for properly interpreting them.

You are no more than a Script-Kiddie and a Pixel-Kiddie with an overinflated opinion of your own abilities, and a soapbox in the public commons, where you loudly and annoyingly proclaim your "Religion".:rolleyes:

It's actually a fallacy in debate, and also problematic. In this case it's not actually relevant because he offered no viable way to "explain" it. We still need to explain those features of that image. If the expert has no explanation, where does that leave us exactly?
Certainly not in a position where anyone should believe your deluded rantings!

I laugh in your general direction!

Well, that technically only works if the expert has an explanation to offer us that is physically viable. In this case, no such explanation exists. Now what?
See above.

They are certainly more "persistent" than anything in the photosphere. The surface features of the photosphere change over about an 8 minute interval.
So? And your point is...?

So what? What do you know about solar physics or satellite images in general?
He knows far more than you ever will!

You do realize I'll bury you in court for this sort of trash, right?
In your dreams.

But you have now spent many many years "burying" multiple fora in your ranting; time that would have been much better spent researching and writing your Earth-Shaking paper, if you had any insights worthy of publication.

Hurry up, the Nobel committee is eagerly waiting to honor you!

... I've long since lost count of the number of times I've watched that video.
As I noted earlier; Pixel-Kiddie.

There's a bit more going on the video and more to consider at it relates to surface tension and gravitational force at various points inside the sphere. First we should note that the gravitational force in the core of the sphere is actually zero. The lighter elements inside of a shell with some surface tension would naturally tend to collect there.
Prove it. With calculations. Show the steps.

Well, it could be relatively "hollow" in terms of average density compared to the outside "shell" as the water bubble analogy demonstrates.

FYI, even a basketball with a hole doesn't necessarily or automatically "collapse" into itself.
FYI, you have absolutely no clue of the relative magnitudes of the forces you are tossing around with such disregard, do you?

Actually, if you read Wiki, you'll find there are a number of variations on the spelling, and everyone insist *their* way is the 'right' one. :)
And your bastardization appears nowhere on the page.

Almost every reference, including the title is spelled the standard way.

The only place I found your spelling was the name of some Punk-Rock band (or some such).

The main issue here is we don't need anything exotic to explain higher energy wavelengths in the atmosphere of an object in space. We already know from discharges on Earth that they occur "naturally'. There is no need to reinvent any new wheels to explain gamma and x-rays from the atmosphere of the sun, especially since discharges will do just fine and occur naturally in many atmospheres of many objects in this solar system, including the sun.
Yeah, yeah, back to the same tired refrain: "naturally", "in a lab with real controls", "on Earth", "no need to reinvent any new wheels", "occur naturally in many atmospheres".

Will you NEVER get the realization that the Sun is vastly different from any other place in this Solar System?

Nope, not until you get to the somewhere that supposed to "reflect" the waves, all the waves mind you, not just a couple of them. That's going to requires a major shift in density.

What is the density just inside the photosphere, and 10 KM into the chromosphere? There isn't enough density change to explain a reflective surface, and you folks can't even explain the clearly defined density transition between the photosphere and chromopshere in your model in the first place! Why is their[sic] a "layer" between them at all?
Proving again that you haven't the slightest clue about Physics.

Do you REALLY not know that as you look deeper in the Solar atmosphere that the density rises fairly rapidly?

How about the fact that a "sharp" boundary in not needed to cause refraction to turn back a wave and "confine" it?

Take a look at gradient-index optics and the related page on G-I optical fibers.

Then Meditate on how Density of the Solar atmosphere vs. depth, Acoustic Refractive Indices vs. depth, and formation of a resonant "cavity" inside even a smallish region of the Solar thickness relate to each other.:eye-poppi

My model actually 'predicts' such a layering process and explains why the light from each layer is sometimes unique to that layer.
And yet, your speculations are demonstrably wrong.

At this rate, you are destined to be forever stuck in "looks like a bunny" logic.:rolleyes:

That last line is the type of thinking that has limited astronomers to dark sticks and stones and primitive belief systems now for decades. We already know that electrical discharges occur in the atmospheres of every large planet in the solar system with an atmosphere of any sort. Why would we not *predict* such things to occur in the solar atmosphere as well?
Well, we all know you are a great expert in "primitive belief systems", (although only as an insider).:rolleyes:

Decades ago, Astronomers also put Alfven and Birkeland in the "History of Science" shelves, but I guess they neglected to send you the memo.

I told you above that the Sun is radically different from "every large planet in the solar system", you need to get beyond that.


There's a problem however once you get the atmosphere of the sun. Without electricity, you simply don't have the conditions necessary to explain fusion, and yet fusion does occur inside coronal loops above the photosphere of the sun. How? Why?
http://svs.gsfc.nasa.gov/vis/a000000/a002700/a002750/
Yeah, without the electrical detonators, thermonuclear (fusion) warheads would never explode.:rolleyes:

You're going to need electrical energy to explain that sort of energy release once you get above the photosphere, because there is simply no other way to create that sort of process without it. The conditions simply do not exist to explain it any other way. The photosphere is only 6K degrees. You still need to explain a 10-20 million degree energy release above that surface, and electrical discharges would in fact be the logical first choice.
B.
S.

...
Helioseismology depends on a "reflective surface' and it wouldn't work out all were it now for the crust.

You can even see it's effect on Nickel ions in the Doppler images Kosovichev has personally created. There's no point in ignoring the *REASON* it works in the first place. You need a reflective surface to do that, and the density of the top of the photosphere is simply way too thin to even begin to explain that reflective process.

You wouldn't know what it takes to "reflect" seismic waves if it smacked you in your face.

See my explanation above and try the "meditation" exercise I described.

Cheers,

Dave
 
He never has claimed (as far as I have seen) to be a photo interpreter of solar, limited-passband satellite images. What he has claimed is to thoroughly understand Running Difference (subtraction) processing, and what one can expect the resulting sequence to represent: something you never did until he told you.


[My bolding.] And that is the absolute and demonstrable truth. I was the one who told Michael how running difference images were made in the first place. Back in late 2005 he was spouting the same nonsense, claiming to understand this stuff that he clearly still does not understand. I had to point out the specific method of making the graphs and videos that he worships with that religious-like reverence. He didn't have the slightest idea.

Here's a link to a post from February of 2006, where I pasted one of the IDL scripts that was actually used to process some of the SOHO data into running difference imagery. I included a very thorough description of the process of creating these images and videos, plus some good information about the source material used to create them. I had posted several such descriptions before that, and many more later in that thread, for all the good it did. Oh, in that post there are links to some other good descriptions by SFN members JohnOAS and DaveW.

(For a heaping helping of whacked out, read a few pages forward and back in that material! Wow.)

And here we are, four year after that, and Michael is still claiming, without a shred of evidence, that he understands this stuff. And here we are with a perfect opportunity for Michael to demonstrate his qualifications, and what do we get? Michael is throwing tantrums, badmouthing me, trying to call me out, and dishonestly shed his burden of proof. But not a single speck of support for his claim.

And now we've all read his staunch declarations over the past few pages about how he's going to post his own renditions of running difference videos and demonstrate his qualifications. But his history shows that he'll jump on every opportunity to change the subject and derail the conversation from that. He's been avoiding it for over four years now, and my bet is he'll continue to avoid it. Yes, that level of crackpottery is akin to insanity.

How about it, Michael? I see you have time to whimper and whine a little, maybe toss around a couple of insults. Got some of those videos yet? ;)
 
Kinda diggin' on this running difference algorithm. Using it, I discovered this lovely archipelago in a place that you might not expect to find terrain.

(oh, c'mon, somebody ask)

Unless, of course, running-difference images aren't a reliable way to find terrain.
 

Attachments

  • more.jpg
    more.jpg
    30.7 KB · Views: 13
Kinda diggin' on this running difference algorithm. Using it, I discovered this lovely archipelago in a place that you might not expect to find terrain.

(oh, c'mon, somebody ask)

Unless, of course, running-difference images aren't a reliable way to find terrain.

By definition, difference images aren't a reliable way to find terrain. In fact, if it shows up at all, it ISN'T terrain. It's the change between frames. The terrain won't appear at all. I don't claim to be any sort of expert in modern image manipulation and I couldn't do such things with a computer but I have extensive darkroom experience and I can and have done such things in the darkroom, just as was mentioned above with X-ray processing. Talk about a way to blow through a pack of Kodalith...

If it shows up on a running difference image, its changing in each frame, so it isn't a surface or terrain features. It's turbulence. As a bonus, its turbulence that looks like a bunny.

A
 
By definition, difference images aren't a reliable way to find terrain. In fact, if it shows up at all, it ISN'T terrain.

oh, you're no fun.

So . . . you mean the area in the rectangle is not a solid, rocky surface?

I'd taken 2 pictures about a minute apart, and used those. The running-difference image was rotated 180 deg (after the subtraction) for purely aesthetic reasons.

ETA: wait, if it's just two images, is it a "running difference" or just a "difference?"
 

Attachments

  • RD source region.jpg
    RD source region.jpg
    59.1 KB · Views: 2
Last edited:
You dont seem to understand the 171 pass band light reflects just like white light. You can see reflections from the structures using the 171A light.
I do understand that. You do not understand that there are no structures to reflect the light.

You dont seem to understand that the 171 light comes from the flares and the loop footprints.
You dont seem to understand that the 171 light comes from the flares and the loop footprints and that these are on and above the photosphere. This is at a temperature of ~6000 K and increases with depth.

The surrounding surface is solid iron.
The surrounding surface is your delusion.

The graph I posted shows that 171 light from loops and footprints goes right through the photosphere. This means TRACE can see under the photosphere.
No it does not.
Read your post.
Even if there is some absorption on the high temp graph, 10^-3KeV, right at 171A there is a dip that would account for allowing high intensity light through, enabling the imaging of structures under the photosphere at just the right wavelength.
...
Photosphere absorption and scattering By brantc 4-7-2010.
http://www.box.net/shared/or4yp441nk
You have only done half the work. You now need to show that the 171A light can get through 100's of kilometers of the photosphere.

The photosphere is THIN.
The photosphere is THICK, especially optically.
 
Last edited:
It's not actually that simple as I explained in my previous response. Keep in mind that the sun rotates between the two images and the two images are usually 10-30 minutes apart. The sun rotates left to right in that video, but the video was 'cropped" to keep the image centered. That rotation between images creates those "shadows" on the left side of various items in the image and "bright areas" to the right.
You cannot even read the images you post!

Look at the left hand side. There are area of cooling plasma to the north (top) of an area of heating plasma. This creates the illusion of a structure with a "shadow" to the top. This is obviously not caused by rotation.

Now the illusions of shadows caused by the changes in temperature in these adjoining areas of plasma (they happen to be either side of the flares in the original images) are on all sides except the right-hand side. That could be a consequence of the rotation of the Sun.
 
ETA: wait, if it's just two images, is it a "running difference" or just a "difference?"

I'd just say difference, but my only experience on this has been single images or small numbers of frames. I think the concept of a running difference video is a modern concept based on the ability to digitally process the images. It would take forever and a week by hand, for any reasonable framerate and durations more than a second or two.

A
 
Actually Dr. Neal Hurlburt from Lockheed-Martin Solar and Astrophysics Laboratory has been very specific in explaining that you're wrong. I have personally communicated with him.

So, did someone over there at LMSAL tell you differently? How is it you claim to know more about the intent and results of the TRACE program than the people who designed the equipment and actively participate in the research? How is it you claim to know more about the results than the people at LMSAL whose job it is to acquire and analyze those images?

Your qualifications have been challenged, Michael. Have anything beside your unsupported assertions to back your claim?

:dl:

HOO! HOO! Excellent!

Classic public spanking.

D
 
Status
Not open for further replies.

Back
Top Bottom