Moderated Iron sun with Aether batteries...

Status
Not open for further replies.
We have already seen convincing evidence that fundamental thermodynamics does not allow for the possibility of an iron crust of any kind.

No, we have not. If that were "convincing evidence", by your same logic the photosphere should radiate at millions of degrees just like the corona or 20K degrees like the chromosphere. The layers under the photosphere are cooler and more dense than the photosphere.

We have also seen no rational counterpoint to this argument from either brantc (who favors a solid, rigid surface), or Mozina (who favors a less solid & rigid crust of some ill-defined sort).

How is "a standard volcanic surface" ill-defined?

It is apparent that the whole "mountain" story is simply an optical illusion, where the brain creates mountains out of pure imagination, given a few hints from suggestive lighting.

It's "optically created" in the sense the lighting changes from moment to moment but the "patterns", and specifically the "persistence" of these "rigid features" is no optical illusion. That persistence is specifically related to the surface features that spawn that light/dark emission pattern in the original and the RD images.

Some here have likened it to "seeing bunny rabbits in the clouds",

That's your way of being extremely offensive. Bunnies in the clouds move over time, particularly if we dropped a huge bomb in the atmosphere at that location. They wouldn't remain "rigid" and "persistent" over time. They'd move around like that "flying stuff" seen in the image right after the CME that GM keeps denying is there.

and I don't doubt that is what Mozina is in fact doing, imagining mountains where none really are.
Then provide a "better" scientific explanation" for the persistence of the features over time, both in the RD and Doppler images.


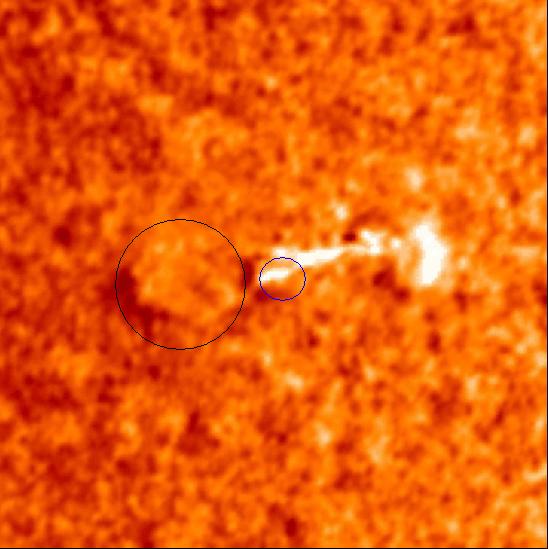
Since fundamental physics does not seem to sway the bias of the True Believer, perhaps another image to counter Mozina's images? Mozina identifies this as Active Region 9143, his image above dated 28 Aug 2000. The structures he identifies as mountains are in fact simply magnetic field loops.

The magnetic fields are directly related to the coronal loops and the layout and movement of the loops, and yes they can be seen in both the original and RD images.

While Mozina's image looks essentially straight down onto the "mountains", other images show the same active region near the limb of the sun. In this viewing geometry, we should see the "mountains" in relief along the rim of the sun; we should be looking at the faces of the slopes of the mountains. But see 171Å Image dated 25 Aug 2000, which clearly shows the magnetic field loops and no sign of mountains in relief anywhere. Furthermore, see the Quicktime movie of the same view of the same region, showing a flare eruption. You can see that the loops are really loops, changing with time, and not static, as one would expect for mountains misinterpreted as loops.

I can see the original image, but not the Quicktime movie on this particular machine for some reason (Windows 7?), but I would imagine it to show all sorts of movements and absorption patterns, certainly not rigid surface features. From the side, looking into the atmosphere we can observe tornado like activity in the solar atmosphere as well. It's a moving and dynamic environment.

http://trace.lmsal.com/Public/Gallery/Images/movies/T171_991127.mov

I can't see that movie on this machine either, but I'm pretty sure it's the one I'm thinking of. It shows "twister" like activity in the atmosphere. The whole thing is very dynamic and flows with the coronal loop activity.

The only way I'm going to get to this post today is to split it up and probably respond fully after work hours.
 
Last edited:
Or really because you must ignore this...
... because addressing it forces you to face the uncomfortable fact that your entire argument is worthless.

Oh just shut up. I just kicked your butt royally when it comes to making "real" RD images. I used the same Solarsoft tools LMSAL uses and NASA uses. You "tinkered around" with whatever you decided to play around with for a few moments. I invested the time to "do them right", including the RD IDL routines you act like you personally wrote yourself. :) Kiss my backside.
 
Oh just shut up. I just kicked your butt royally when it comes to making "real" RD images. I used the same Solarsoft tools LMSAL uses and NASA uses. You "tinkered around" with whatever you decided to play around with for a few moments. I invested the time to "do them right", including the RD IDL routines you act like you personally wrote yourself. :) Kiss my backside.

Shall we take a vote on that?
 
If you really feel like you all need the emotional support, and really need to bond again now, by all means pat him on the back. :)
 
It's "optically created" in the sense the lighting changes from moment to moment but the "patterns", and specifically the "persistence" of these "rigid features" is no optical illusion. That persistence is specifically related to the surface features that spawn that light/dark emission pattern in the original and the RD images.


No, it is not. Each pixel in the source images was brighter if it was closer to being picked up by the 171Å filter, and dimmer if it was further away. The 171Å filter is used to visualize thermal characteristics. Since all the data that was used to create the source images comes from the corona, there is nothing at all you can do with that data to somehow magically change it into a picture of something thousands of kilometers below and through the opaque photosphere.

Seems that your simple act of following the directions on a package of software and feeding it a script hasn't changed your radical misunderstanding of running difference images one little bit.

That's your way of being extremely offensive. Bunnies in the clouds move over time, particularly if we dropped a huge bomb in the atmosphere at that location. They wouldn't remain "rigid" and "persistent" over time. They'd move around like that "flying stuff" seen in the image right after the CME that GM keeps denying is there.


There is nothing rigid in the corona of the Sun. Nothing. And your bunnies in the clouds are moving over time, a lot, the fact that you refuse to understand Tim's well described explanation notwithstanding.

Oddly enough you're spending all this time whining about being offended when you could be actually supporting your crackpot claim. But how about we try this another time...

Now, how about you explain the method you've used to take data obtained from the Sun's corona, thousands of kilometers above the photosphere, and somehow process that into something that supposedly shows a solid surface below the photosphere.
 
Oh just shut up. I just kicked your butt royally when it comes to making "real" RD images. I used the same Solarsoft tools LMSAL uses and NASA uses. You "tinkered around" with whatever you decided to play around with for a few moments. I invested the time to "do them right", including the RD IDL routines you act like you personally wrote yourself. :) Kiss my backside.


And in all your "doing them right" you apparently still can't explain what process is applied to each pixel in each source image to generate the results in the output running difference graph. If you did you'd understand that the things you see in those images are not surface features. But just to make sure you get every possible chance to explain yourself...

Now, how about you explain the method you've used to take data obtained from the Sun's corona, thousands of kilometers above the photosphere, and somehow process that into something that supposedly shows a solid surface below the photosphere.
 
Last edited:
Suppose we kept flashing the surface from above with bright lights, back and forth from different angles over time. Would we not be able to "pick out the persistent surface patterns" in the RD images?

Do you think this is what is happening here?
 
Do you think this is what is happening here?

Well, sort of, but only in a highly overly simplistic manner. The coronal loops are the light source of the original images and they change over time. They produce the light we observe and that light reflects off of "stuff", including that flying stuff in the atmosphere right after the CME event that moves from the lower right toward the upper left of the image.
 
Outstanding questions for Micheal Mozina

Hi MM any progress in these?
These are some of the questions that MM has been asked about his Iron Sun idea and seems incapable of answering other than by unsupported assertions.

  1. What is the amount of 171A light emitted by the photosphere and can it be detected? First asked 6th July 2009
  2. A post that seemed to retract his "mountain ranges" on the TRACE 171A RD animation evoked this question:
    What discharge rates and processes come from your hypothetical thermodynamically impossible solid iron surface to show up as records of change in the RD animation in the corona. First asked 6th July 2009
  3. From tusenfem:
    Where is the the solar wind and the appropriate math in Birkeland's book? First asked 7th July 2009
  4. Please cite where in his book Birkeland identified fission as the "original current source" and in the same post
  5. Please cite where in his book Birkeland identified a discharge process between the Sun's surface and the heliosphere (about 10 billion kilometers from the Sun). First asked 7th July 2009
  6. Is your solid iron surface thermodynamically possible? First asked 8 July 2009
    See this post for a fuller explanation of the thermodynamic problems with MM's solid iron surface.
  7. Coronal loops are electrical discharges? First asked 10 July 2009
    This is an updated question with a couple of "answers" from MM.
  8. Can Micheal Mozina answer a simple RD animation question? First asked 10 July 2009
  9. More questions for Michael Mozina about the photosphere optical depth First asked 13 July 2009
  10. Formation of the iron surface First asked 13 July 2009
  11. How much is "mostly neon" MM? First asked 13 July 2009
  12. Just how useless is the Iron Sun model? First asked 13 July 2009
  13. Coronal loop heating question for Michael Mozina First asked 13 July 2009
  14. Coronal loop stability question for Michael Mozina First asked 13 July 2009He does link to his copy of Alfvén and Carlqvist's 1966 paper (Currents in the Solar Atmosphere and A theory of Solar Flares). This does not model what we now know a real solar flare acts like.
  15. Has the hollow Iron Sun been tested? First asked 14 July 2009
  16. Is Saturn the Sun? First asked 14 July 2009(Birkelands Fig 247a is an analogy for Saturn's rings but MM compares it to to the Sun).
  17. Question about "streams of electrons" for Micheal Mozina First asked 14 July 2009MM has one reply in which is mistakenly thinks that this question is about coronal loops.
  18. What is the temperature above the iron crust in the Iron Sun model? First asked 17 July 2009
  19. What part of the Sun emits a nearly black body spectrum with an effective temperature of 5777 K?
    (MM states that it is not the photosphere) First asked 18 July 2009
  20. Is the iron surface is kept cooler than the photosphere by heated particles? First asked 18 July 2009
  21. Entire photon "spectrum" is composed of all the emissions from all the layers First asked 3 August 2009
  22. Same event in different passbands = surface of the Sun moves? First asked 22 July 2009
    Seems to think that 3 pixel differences (full Sun image) or 10's of pixels (limb image) are not detectable. Astronomers would disagree.
  23. Evidence for the existence of "dark" electrons First asked 28 July 2008
  24. Why neon for your "mostly neon" photosphere? First asked 30 July 2009
  25. Where is the "mostly fluorine" layer? First asked 30 July 2009
  26. What is your physical evidence for "mostly Li/Be/B/C/N/O" layers? First asked 30 July 2009
  27. What is your physical evidence for the "mostly deuterium" layer? First asked 30 July 2009
  28. Explain the shape of your electrical arcs (coronal loops) First asked 2 August 2009
  29. What is your physical evidence for the silicon in sunspots? First asked 7 August 2009
  30. How do MM's "layers" survive the convection currents in the Sun? First asked 26 December 2009
  31. Where are the controllable empirical experiments showing the Iron Sun mass separation?
    First asked 5 January 2010
  32. How can your iron "crust" not be a plasma at a temperature of at least 9400 K?
    First asked 7 April 2010
  33. How can your "mountain ranges" be at a temperature of at least 160,000 K?
    First asked 8 April 2010
  34. Where is the spike of Fe composition in the remnants of novae and supernovae?
    First asked 8 April 2010
  35. Which images did you use as your input for the PM-A.gif image, etc.?
    First asked 8 April 2010
Actual Answers From Michael Mozina::dl:
 
No, it is not. Each pixel in the source images was brighter if it was closer to being picked up by the 171Å filter, and dimmer if it was further away.

That's the first bush league mistake on your part. Brighter has nothing to do with "closer" and "further away" and everything to do with "temperature" and "current flow". The current flow heats the plasma to millions of degrees. It's *hot* and typically hottest in the brightest areas of the image.
 
The 171Å filter is used to visualize thermal characteristics. Since all the data that was used to create the source images comes from the corona, there is nothing at all you can do with that data to somehow magically change it into a picture of something thousands of kilometers below and through the opaque photosphere.

That's your second bush league mistake, although frankly LMSAL's guilty of leading you, me and everyone astray on that one. You just "assumed" where you expect to find the bases of the loops.

Seems that your simple act of following the directions on a package of software and feeding it a script hasn't changed your radical misunderstanding of running difference images one little bit.

So far you've yet to "explain" a single pixel in terms of solar physics. Cat got your tongue or what? You're sure quick to bitch when I don't do your personal bidding and so quick to run away from the persistence in the image or the *CAUSE* of anything as it relates to solar physics.
 
Where did your "mountain ranges" go in Active Region 9143

Tim Thompson's Active Region 9143 & "Mountains" on the Sun post needs yet another question for Micheal Mozina.
The RD movie that gives the illusion of "mountain ranges" due to the heating and cooling plasma on either side of the flares was taken looking down on Active Region 9143.
But when the same region is on the limb of the Sun, there are no mountain ranges seen despite the Sun being imaged in the same 171A passband! All we see are coronal loops.

First asked 14 April 2010
Micheal Mozina,
Where did your "mountain ranges" go in Active Region 9143 between the time that they were imaged and the time that the region got to the limb?
 
MM,
Why are you looking at something opaque and using the worst possible method to search for something that cannot be there?
Who are you trying to impress?
 
Suppose we kept flashing the surface from above with bright lights, back and forth from different angles over time. Would we not be able to "pick out the persistent surface patterns" in the RD images?


No, we would not. And anyone who is remotely familiar with the specifics of the purpose, data acquisition, construction, and results of processing running difference videos knows better than to believe we would. The photosphere is opaque. You can't see through it. Nothing reflects off of anything below it. That's what opaque means.

Care to answer this?...

Now, how about you explain the method you've used to take data obtained from the Sun's corona, thousands of kilometers above the photosphere, and somehow process that into something that supposedly shows a solid surface below the photosphere.
 
Do RD movies of inactive regions show "mountain ranges"

The previous question (Where did your "mountain ranges" go in Active Region 9143) also raises this question:

First asked 14 April 2010
Micheal Mozina,
You only cite one RD movie that shows "mountain ranges". We would expect that images of the Sun from any region when made into RD movies will magically reveal your "mountain ranges".
So you will have as a competent scientist tested this :rolleyes:.

Can you show us the RD movies of inactive regions of the Sun that show similiar "mountain ranges" as the RD movie of AR 9143?

(I do have a suspicion that your answer will involve impossible electrical discharges through plasma)
 
MM,
Why are you looking at something opaque

What is "opaque" in your opinion, and what makes it "opaque" to the 171A and 195A wavelengths?

and using the worst possible method to search for something that cannot be there?

What besides heliosiesmology and solar satellite imagery would you suggest I use?
 
Tim Thompson's Active Region 9143 & "Mountains" on the Sun post needs yet another question for Micheal Mozina.
The RD movie that gives the illusion of "mountain ranges" due to the heating and cooling plasma on either side of the flares was taken looking down on Active Region 9143.
But when the same region is on the limb of the Sun, there are no mountain ranges seen despite the Sun being imaged in the same 171A passband! All we see are coronal loops.

First asked 14 April 2010
Micheal Mozina,
Where did your "mountain ranges" go in Active Region 9143 between the time that they were imaged and the time that the region got to the limb?


This issue of observing these events at the limb of the Sun has been explained to Michael many times. It's oddly interesting that he simply ignores it, but it makes sense if it's because those particular facts are inconvenient to his faith in the solid surface Sun myth. You see, observing solar activity straight on and the same activity at the limb is how we know that the data used to create those 171Å source images comes from the corona. It's how we know that nothing in a running difference image made from those EIT sources comes from below the photosphere. None of it.
 
The previous question (Where did your "mountain ranges" go in Active Region 9143) also raises this question:

First asked 14 April 2010
Micheal Mozina,
You only cite one RD movie that shows "mountain ranges". We would expect that images of the Sun from any region when made into RD movies will magically reveal your "mountain ranges".
So you will have as a competent scientist tested this :rolleyes:.


He only figured out how to make a running difference image this past weekend. :p
 
What is "opaque" in your opinion, and what makes it "opaque" to the 171A and 195A wavelengths?


Opaque means no light at any wavelength can get through. Any wavelength would include 171Å and 195Å. What makes it opaque is the density of the plasma.

What besides heliosiesmology and solar satellite imagery would you suggest I use?


Solar satellite imagery does not, and cannot show a solid surface because it cannot see anything below the photosphere. And helioseismology actually does more damage to your myth. It shows clearly that there is not a solid surface. Looks like you're just out of luck.
 
Just how high are your "mountain ranges"

This issue of observing these events at the limb of the Sun has been explained to Michael many times. It's oddly interesting that he simply ignores it, but it makes sense if it's because those particular facts are inconvenient to his faith in the solid surface Sun myth. You see, observing solar activity straight on and the same activity at the limb is how we know that the data used to create those 171Å source images comes from the corona. It's how we know that nothing in a running difference image made from those EIT sources comes from below the photosphere. None of it.
I was fairly sure that this basic bit of science would have been pointed out to Micheal Mozina many times before.

It is amazing what kind of silliness you can get if you look at his web site. Tim Thompson's Active Region 9143 & "Mountains" on the Sun post mentioned it and I had another look. On the first page he has the AR 9143 image with his mountain ranges. But I had never noticed the image below (it may be new). The caption is "This "running Difference" image of the sun's surface was captured by SOHO. This NASA image was taken on May 27th 2005 at 19:13 using the 195A filter that is sensitive to iron ion emissions. These same complex visible surface structures are visible even days and weeks later."
So we have the same ignorance of the fact that the 195A filter is capturing light from the corona.

However the 2 images provide yet another blow to is idea.
Micheal Mozina,
The first RD image shows your illusionary "mountain ranges" in a small region of the Sun's surface. In theory you could work out how high the "mountains" are from the shadows.
The second RD image shows your illusionary "mountain ranges" over all the Sun's surface. In theory you could work out how high the "mountains" are from the shadows.

First asked 14 April 2010
The first problem is that there are no light sources for the second image! It is an image of the entire Sun.
So where do the shadows come from?

First asked 14 April 2010
The major problem is that the shadows in each image are enormously different in size.
Why do your "mountain ranges" seem to be an order of magnitude higher in the second image?
 
[...] However the 2 images provide yet another blow to is idea.
Micheal Mozina,
The first RD image shows your illusionary "mountain ranges" in a small region of the Sun's surface. In theory you could work out how high the "mountains" are from the shadows.
The second RD image shows your illusionary "mountain ranges" over all the Sun's surface. In theory you could work out how high the "mountains" are from the shadows.


You absolutely could. You could take those images of what Michael believes are mountains and valleys, reconstruct a similar terrain in any decent 3D modeling program, mess with the location, angle, and intensity of light, and determine with some reasonable accuracy how tall the mountains and how deep the valleys. This very idea has been proposed to Michael on more than one occasion, but as simple as it might be, he ignores it. He'd rather stick to his unsupported assertions and cling to his strategy of badmouthing and belittling those of us who offer legitimate, reasonable, evidenced criticism of his crackpot conjecture. Odd behavior for a Nobel Prize winner wannabe? Well if he's really got the stuff, it certainly is.
 
Last edited:
Suppose we kept flashing the surface from above with bright lights, back and forth from different angles over time. Would we not be able to "pick out the persistent surface patterns" in the RD images?

Maybe, although there would be all sorts of artifacts (shadows, bright and dark areas, etc.). It would be an extremely poor way to do it, because you're subtracting away the most obvious and persistent features.

The right way to do it is stack images (which will cancel out lighting variations), or just look at the images themselves. It really makes no sense to take RD images for that purpose, and if the features you see are only present in RD images, they aren't a solid surface.

But of course we already knew that, because based on centuries of accumulated theory and experiment in chemistry, phase transitions, thermodynamics, and materials science - it's completely impossible for the sun to have a solid surface.
 
Finding out what is really going on with solar models and observations took some digging.

But I think I did get to the bottom of it "all".

The transition layer is where SM(standard model) says it is(1 point). 2000Km above the surface of the sun.

Before TRACE the observations consisted of associating flows with areas per time. That was because that was the limit of their resolution. So they had good x-y determination but not good Z(depth).

TRACE can see 1 arc second on the limb, ~759 km.

Here is the TRACE calibration paper from 1999 when they were trying to remove cross channel contamination....

Page 9 or 359 has an image of what they called "the ghost Limb" taken in the UV.
http://wwwsolar.nrl.navy.mil/rockets/vault/pubs/trace.pdf

The ghost limb is 2 arc seconds above the "true" limb. If you read the text you might try to say "Its an artifact" or what ever. But if you go to this paper they refer to the ghost limb in the Handy paper in connection with a flare event and a image of the event in the ghost limb.

"Panel b shows the prominence as loop-shaped emission at 1216 °A, where the bright spot below the northern leg is, most likely, an UV continuum rightening on the ghost limb that appears 2′′ above the true limb (Handy et al. 1999, their Fig. 5)."
http://arxiv.org/PS_cache/arxiv/pdf/0902/0902.1805v2.pdf

That ghost limb is 2000km above something. and that something shows up in the UV.

I say its the ghost limb is the transition layer. That means the photosphere is 1 arc second(100km) below the the transition layer in the images. This makes sense since it should not show up in a 1200 image.

"Correlating the 1216 and 1600 Å images to one another places the 1600 Å limb squarely on this ghost limb"

Yes, that would place the photosphere on the ghost limb if you thought that it was a ghost limb and not the transition region.

This is exactly why there is the confusion between heliosphere data and photosphere observations. Because they are sticking to the model that has been fitted to the data from day one.

The observations are correct. And they do make sense if you use a different model.

1. The observation is that the photosphere is at some diameter. It is.
2. The heliospheric observation is that the true surface of the sun is below the photosphere. It is.
3. The TRACE observation is that the transition layer is 2 arc seconds(2000Km) above the lower limb as imaged at 1200A. It is.
4. Traces observations that events happen on this ghost limb establishing its existence.
5. Subtracting the diameter of the sun at the photosphere with the TRACE observations and heliospheric observations says we are seeing the surface of the sun in 1200A.

The lower limb is the true surface of the sun. Its below the photosphere. And its visible in UV.

This is the iron surface below the photosphere.

Last thing is to account for where the energy comes from across the spectrum.
I will show that very little heat leakage "backwards" into the photosphere region combined with an acceleration by electric field allows for the existence of an iron sun.
 
Again, out of curiosity, how come brantc's explanation is at odds with those of the rest of the physics community and what are the mathematical difference between the models. Do yours work for other observations? Water stops blue light cold after not that much depth, does that show up in your alternate model?

The problem is the standard model of the sun. Not the observations.

My photosphere absorption graph is not at odds with physics. You can make your own at TOPS opacity database using numbers from wiki.

My description of the photosphere is strictly based on physics, the plasma physics of the electrical cathode.

My model of what the sun is made out(iron) and how it is powered(electricity) is at odds with the astronomy community.

My model of gravity to allow the iron sun is at odds with the physics community even though they really dont have anything better.

I think that a Le Sage type of gravity is correct.
 
Again, out of curiosity, how come brantc's explanation is at odds with those of the rest of the physics community and what are the mathematical difference between the models. Do yours work for other observations? Water stops blue light cold after not that much depth, does that show up in your alternate model?
The difference is that science does have a model of the Sun which mostly works (the coronal heating problem is one gap to be filled).
brantc and Micheal Mozina do not have a model.
brantc has a vague idea that is easily shown to be false:
  1. The photosphere is at ~6000 K, temperature is observed to increase with depth to ~9400 at about 500 km is observed thus his iron shell below the photosphere is at at least 9400 K and a plasma.
  2. Observations of the Sun's vibrations give us the location and velocity of convection currents under photosphere and this rules out any solid surface.
  3. There is the delusion he seems to share with MM that this surface can be seen in images that can only see light from the corona.
  4. etc (see the 30-odd questions for MM and handful of questions for brantc).
 
My photosphere absorption graph is not at odds with physics. You can make your own at TOPS opacity database using numbers from wiki.
As I stated before: You have just done half the job.
The opacity calculated does not mean that the photosphere is transparent.
It means that light at that wavelength is effectively absorbed by a certain amount of plasma. Now you have to show that the height of the photosphere above your iron shell is insufficient to do this.

My model of gravity to allow the iron sun is at odds with the physics community even though they really dont have anything better.
You have stated no model of gravity.
The physics community does have something better - General Relativeiy.

I think that a Le Sage type of gravity is correct.
And exactly how does "a Le Sage type of gravity" prevent your iron shell from vaporizing in > 9400 K temperatures or collapsing under its own weight?
 
What is "opaque" in your opinion, and what makes it "opaque" to the 171A and 195A wavelengths?
Opaque as in not letting light though?
What besides heliosiesmology and solar satellite imagery would you suggest I use?

Helioseismology sounds like a good idea to learn about the inside of the sun.
As it does not support your ideas, perhaps you should try dowsing instead?
 
...
If you want to uncover static features, you do the opposite of taking differences: you take sums - averages - of many stacked images. That cancels the random variations and enhances the persistent features.
I presume that Michael, even though ISTR he claims to have some expertise with Electronics or even Engineering, has never been introduced to the well-known and widely used techniques of signal averaging.:eye-poppi
It is often a built in software feature in modern digital storage oscilloscopes (DSO), and is common in any stimulus-response type testing where the response is deeply buried in noise, up to and including measuring evoked potential in neurological and neuroscience studies and sonar and radar.

It could be directly applied to two dimensional images by pixel-by-pixel add-then-normalize methods through the sequence. Simple to do on a computer.

And in all your "doing them right" you apparently still can't explain what process is applied to each pixel in each source image to generate the results in the output running difference graph. If you did you'd understand that the things you see in those images are not surface features. But just to make sure you get every possible chance to explain yourself...
Of course not!

As I said before, Mozina is a Pixel-Kiddie. (He stares at images/sequences for hours on end until he can "See the Bunny").

Mozina is a Script-Kiddie. (He spent/wasted DAYS after GM's challenge on acquiring/setting up a new machine and enormous software suite with all the bells and whistles and yet had to follow someone else's script to generate his first RD sequence. He told us all what he had to do.:jaw-dropp).

That's the first bush league mistake on your part. Brighter has nothing to do with "closer" and "further away" and everything to do with "temperature" and "current flow". The current flow heats the plasma to millions of degrees. It's *hot* and typically hottest in the brightest areas of the image.
I believe that the "closer" and "further away" he mentioned were in the FREQUENCY domain relative to the filter passband, not the spatial domain, as you naively assume. I thought you knew Electronics!
ETA: An emission curve such as blackbody distribution being "closer to" or "further from" "centered" in the filter passband (as a direct consequence of temperature) would effectively show as "brighter" or "dimmer" as a function of the peak's centering on the PB.

Idiot.


Cheers,

Dave
 
Last edited:
Well, sort of, but only in a highly overly simplistic manner. The coronal loops are the light source of the original images and they change over time. They produce the light we observe and that light reflects off of "stuff", including that flying stuff in the atmosphere right after the CME event that moves from the lower right toward the upper left of the image.

As Sol says, even if this did work (I doubt it very strongly) its an incredibly stupid way of doing things and you'd probably be better off doing nothing.
And of course the Sun is far too hot to have a solid iron surface.
 
As Sol says, even if this did work (I doubt it very strongly) its an incredibly stupid way of doing things and you'd probably be better off doing nothing.
And of course the Sun is far too hot to have a solid iron surface.

It's super nano iron.
 
Suppose we kept flashing the surface from above with bright lights, back and forth from different angles over time. Would we not be able to "pick out the persistent surface patterns" in the RD images?


That is a post hoc rationalization in an apparent attempt to cover a serious deficiency in your understanding. There are no bright flashing lights involved in creating a running difference image. There are two source images, neither of which has anything to do with "flashing the surface from above with bright lights, back and forth from different angles over time". Each source image is a measurement of thermal characteristics. Typically 171Å light is showing us where the corona is around a million degrees Kelvin. That's the corona, from several thousand to tens of thousands of kilometers above the photosphere, nowhere near your imaginary iron shell.

The brightness of any one pixel in the 171Å source image is caused by that filter's sensitivity to light in roughly the million degree range. Dimmer pixels are cooler or hotter. All the light comes from thousands of kilometers above the photosphere. The source images are gathered much like a regular camera gathers light for a snapshot. They're still images taken with no "flashing the surface from above with bright lights, back and forth from different angles over time". To suggest that would be a gross misrepresentation of how it actually works.

To make a running difference image, a second 171Å source image is used as well as the one described above. It was taken some amount of time after that first one. Another still image, no flashing, no angles, no back and forth. All the pixels in that second image are caused by the same thing as the ones in the first, light at 171Å typically generated in plasma around a million degrees. Hotter plasma won't show in the image. Cooler plasma won't show. (Brighter does not mean hotter. It means closer to the maximum sensitivity of the filter.) And just like the first image, all the light comes from several thousand kilometers up to tens of thousands of kilometers above the photosphere.

So we take these two images, both created by 171Å light, all of which comes from the corona, neither of which is anything like "flashing the surface from above with bright lights, back and forth from different angles over time", and we do a simple mathematical comparison. Each pixel's brightness is represented as a numerical value. (Yes, this stuff is quantitative regardless of Michael's dreaded avoidance of that part of science.) Pixel A1 in Image 1 is compared to pixel A1 in Image 2. The result of that calculation, simply the mathematical difference between the values of the pixels, becomes pixel A1 in the output, the running difference graph. Move on and do exactly the same thing to pixel A2, then A3, then A4... and eventually the output of the process is completed.

What we end up with is a graphical representation of a mathematical comparison of the values of the corresponding pixels in a pair of source images. It's a graph, a chart, a way to visually represent a change in brightness between the pixels in the original images. The running difference image is no longer a picture of anything physical. You can't see stuff in it. You can't see things in it. No surface, no hills, no valleys, nothing. Nothing will appear in the output that didn't appear in one of those source images and change in the other.

There. Every pixel in every running difference graph. Explained. Every single last blessed pixel. Explained. In plain English that checks to about a 9th grade reading level.

Now if I'm wrong -- which, by the way, would make the people at LMSAL wrong, and the people at NASA, all the people involved with the SOHO and STEREO and TRACE solar research projects, among others, who work with these images every single day -- if I'm wrong, and if there's a better way to describe it, quantitatively of course, Michael has yet to attempt it. For some reason he refuses to explain why, for example, the pixel in column 418 row 114 has the value that it has in the first image, why that pixel in the second image has its value, and how those values, after doing a simple mathematical comparison, can suddenly become part of an actual picture of something that would have been impossible to see in either of the source images.

And my prediction is: We will never see his pixel by pixel explanation because Michael does not have the qualifications he claims to have regarding his understanding of satellite imagery in general and running difference graphs in particular. His use of those very first images on his web site as evidence for his crackpot solid surfaced Sun conjecture is fraud. And anyone who doesn't like it can sue me. :)
 
To make a running difference image, a second 171Å source image is used as well as the one described above. It was taken some amount of time after that first one. Another still image, no flashing, no angles, no back and forth. All the pixels in that second image are caused by the same thing as the ones in the first, light at 171Å typically generated in plasma around a million degrees. Hotter plasma won't show in the image. Cooler plasma won't show. (Brighter does not mean hotter. It means closer to the maximum sensitivity of the filter.) And just like the first image, all the light comes from several thousand kilometers up to tens of thousands of kilometers above the photosphere.

So we take these two images, both created by 171Å light, all of which comes from the corona, neither of which is anything like "flashing the surface from above with bright lights, back and forth from different angles over time", and we do a simple mathematical comparison. Each pixel's brightness is represented as a numerical value. (Yes, this stuff is quantitative regardless of Michael's dreaded avoidance of that part of science.) Pixel A1 in Image 1 is compared to pixel A1 in Image 2. The result of that calculation, simply the mathematical difference between the values of the pixels, becomes pixel A1 in the output, the running difference graph. Move on and do exactly the same thing to pixel A2, then A3, then A4... and eventually the output of the process is completed.

Do you know what the time separation of the two images is, and how they are aligned before the difference is taken?
 
Do you know what the time separation of the two images is, and how they are aligned before the difference is taken?


In the video I made...


... the source images were from the 171Å video posted on April 8, 2010, on the SOHO movies of the day page. The frames that made up that video were mostly at six hour intervals from 01:00UTC on February 2, 2010 until 19:00UTC on April 8, 2010. The frames are obviously aligned with the disc of the Sun overlaid in place. To the best of my knowledge the images were acquired from a stationary location and all the apparent rotation is indeed the rotation of the Sun.

Interesting to note that several frames in the original video are missing due to incomplete data. The result is that there are a few places where the running difference video seems to jump to a much higher contrast then back to its normal, smoother appearance. What's happening there, of course, is the difference comparison is being made between source images which are further apart.

So what is not happening? Well for one thing, those mountains you see in all those running difference images, the ones that look like they're growing by some massive amount then returning to their previous size? Those mountains are not growing and shrinking. (Hint, Michael: They're not mountains.)

Wow. Imagine that. I can actually control the height of the mountains on the Sun by dropping a few frames from an original series of 171Å source images. I can also do it across the entire video by creating a greater offset, comparing original frames that are more than a single frame apart. :eek:

I repeat, because this is important... The apparent height of the mountains on the Sun's surface can be manipulated by changing the amount of time between the source images used for the comparison. The optical illusion can be changed that easily. And...

If I were to run the calculation on each frame prior to the base image for each comparison, rather than using the frame after the base image, I can make all those highlights and shadows on all those mountains come from the other direction! ;)

Probably much as you surmised.

Hope this answers your question. :)

ETA: I added a link to the running difference video made from the 195Å version of essentially the same source. The original data for this one was mostly in intervals of roughly a half hour. It begins March 25, 2010, and goes through April 8. You'll notice there are more obvious jumps to that "higher mountain" illusion because there are more individual missing frames in the original video and/or there are places where more than one frame is missing. This obviously will make the difference greater for the comparison.

Here's the video made from the 195Å sources...

 
Last edited:
In the video I made...


... the source images were from the 171Å video posted on April 8, 2010, on the SOHO movies of the day page. The frames that made up that video were mostly at six hour intervals from 01:00UTC on February 2, 2010 until 19:00UTC on April 8, 2010. The frames are obviously aligned with the disc of the Sun overlaid in place. To the best of my knowledge the images were acquired from a stationary location and all the apparent rotation is indeed the rotation of the Sun.

Interesting to note that several frames in the original video are missing due to incomplete data. The result is that there are a few places where the running difference video seems to jump to a much higher contrast then back to its normal, smoother appearance. What's happening there, of course, is the difference comparison is being made between source images which are further apart.

So what is not happening? Well for one thing, those mountains you see in all those running difference images, the ones that look like they're growing by some massive amount then returning to their previous size? Those mountains are not growing and shrinking. (Hint, Michael: They're not mountains.)

Wow. Imagine that. I can actually control the height of the mountains on the Sun by dropping a few frames from an original series of 171Å source images. I can also do it across the entire video by creating a greater offset, comparing original frames that are more than a single frame apart. :eek:

I repeat, because this is important... The apparent height of the mountains on the Sun's surface can be manipulated by changing the amount of time between the source images used for the comparison. The optical illusion can be changed that easily. And...

If I were to run the calculation on each frame prior to the base image for each comparison, rather than using the frame after the base image, I can make all those highlights and shadows on all those mountains come from the other direction! ;)

Probably much as you surmised.

Hope this answers your question. :)

Yes, thank you.

The sun rotates every 25 days, and the SOHO satellite orbits it once every earth year (so we can more or less neglect SOHO's motion). That means that it takes a point on the edge of the disk in a SOHO image about 12 days to migrate to the corresponding point on the other side. So in 6 hours, it moves about 2% of the way across.

Therefore if there were persistent features on the surface, the running difference images would reveal a kind of rind or edge of them that should gradually drift across the disk, arriving at the opposite edge after at most 50 frames. These features would remain always at exactly the same "latitude", and with exactly fixed distance between them.

For a feature with a circular cross section, in each frame of the RD movie you'd see a double crescent moon shape forming roughly a ring or figure 8 (imagine two disks overlaid, canceling out where they overlap). That ring would drift across the image on a straight latitude line as the RD movie plays, moving 2% of the disk width at that latitude each frame. A skipped frame should make the feature into more of a figure 8 and less of a ring, and larger (possibly much larger if it was a feature with small angular size). If it's fixed, 12 days after it rotates out of view the same feature should emerge again on the visible face of the sun at the same latitude.

So one very, very simple test Michael's "idea" is to make sure all these supposedly solid features always remain at exactly the same latitude. I'm sure people that study sunspots, etc. have looked at that, since it's probably quite interesting to know how long sunspots persist and how they move.
 
The problem is the standard model of the sun. Not the observations.

My photosphere absorption graph is not at odds with physics. You can make your own at TOPS opacity database using numbers from wiki.

My description of the photosphere is strictly based on physics, the plasma physics of the electrical cathode.

My model of what the sun is made out(iron) and how it is powered(electricity) is at odds with the astronomy community.

My model of gravity to allow the iron sun is at odds with the physics community even though they really dont have anything better.

I think that a Le Sage type of gravity is correct.

And the currents for the sun come from where?
 
Opaque as in not letting light though?

Which light? All light? Every single wavelength regardless of the energy state? That's a nice trick for a "surface" that's thinner than the atmosphere of the Earth at sea level, and supposedly composed primarily of hydrogen and helium. It's not "opaque" to every single wavelength, not equally, and not the iron ion wavelengths as Brantc demonstrated with the TOPS data.

There's not "magic surface" of light plasma that blocks every single wavelength in the first millimeter of the photosphere.

Helioseismology sounds like a good idea to learn about the inside of the sun.

Indeed. It's the one sure way to be able to "see" under the surface. The find a significant subsurface stratification process going on at about .995R where there is supposed to be an open (and flowing) convection zone according to gas model theory.

http://arxiv.org/abs/astro-ph/0510111

As it does not support your ideas, perhaps you should try dowsing instead?

Actually it does support my idea, so I'll just stick with the theory. :)

tsunami1.JPG


Both the RD and Doppler images show "persistent features" under the photosphere that have lifespans and "rigidity" unlike any kind of ordinary plasma. It's "rigid"" and persistent even in the presence of a huge CME in that RD LMSAL image. It's present in the tsunami video too and is completely unaffected by the wave in the photosphere. The same technology that reveals the wave in the photosphere also reveals rigid features below the photosphere too.
 
Status
Not open for further replies.

Back
Top Bottom