Michael Mozina
Banned
- Joined
- Feb 10, 2009
- Messages
- 9,361
Anything with a +- 1200 Km will do by the way, nothing fancy is necessary.
Come on. I'm not looking for the anything other than a ballpark figure on the circumference of the RD sphere at 171A?
Michael, please answer a few simple questions.
a) Did I or did I not explain where an optically-thin corona layer will show up in 2D projection? Was there something wrong with that explanation?
b) Did I or did I not explain where a self-semi-opaque corona layer will show up in 2D projection? Was there something wrong with that explanation?
c) Did I or did I not explain where a externally-absorbed corona layer will show up in 2D projection? Was there something wrong with that explanation?
Dear Mr. Spock,
Since you were so kind to give GM a hand on his last project about how far GM thinks I can see into the atmosphere, and you obviously have the angle stuff down pat, could you please be so kind as to help him again with his RD image project? He seems to be the resident expert on things related to RD images so the two of you should be able to work out something.
I'm not looking for anything fancy, just a simple "ballpark" will do. I'm specifically interested in 171A, and I'll be happy with 1200KM either direction. Anything close will do, so long as we have some way to distinguish between the two theories. I just want to know what you think the circumference of the RD sphere will be.
Come on. I'm not looking for the anything other than a ballpark figure on the circumference of the RD sphere at 171A?
Come on. I'm not looking for the anything other than a ballpark figure on the circumference of the RD sphere at 171A?
The moss consists of hot gas at about two million degrees Fahrenheit which emits extreme ultraviolet light observed by the TRACE instrument. It occurs in large patches, about 6,000 - 12,000 miles in extent, and appears between 1,000 - 1,500 miles above the Sun's visible surface, sometimes reaching more than 3,000 miles high. It looks "spongy" because the patches are composed of small bright elements interlaced with dark voids in the TRACE images. These voids are caused by jets of cooler gas from the Sun's lower atmosphere, the chromosphere, which is at about 10,000 degrees Fahrenheit. The bright moss elements move around and can vary in brightness over very short periods of time -- 30 seconds or less.
There is no such thing as a "figure on the circumference of the RD sphere at 171A". That's a string of words, yes, and they are pretty much all English, yes, but the way they're strung together makes the combination meaningless.
http://www.solarviews.com/eng/tracepr2.htm
Does that help?
Those are three separate RD images (from NASA). You can't see a sphere and a figure out a circumference?
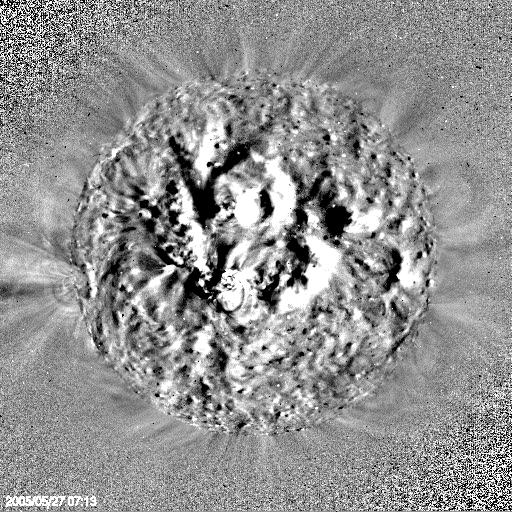
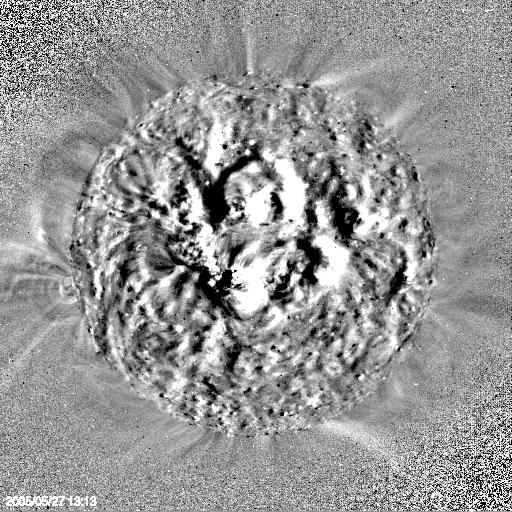
[qimg]http://www.thesurfaceofthesun.com/images/20050527-0713.JPG[/qimg]
[qimg]http://www.thesurfaceofthesun.com/images/20050527-0713.JPG[/qimg]
[qimg]http://www.thesurfaceofthesun.com/images/20050527-1313.JPG[/qimg]
Those are three separate RD images (from NASA). You can't see a sphere and a figure out a circumference?
I do not see a sphere. I see a disk. A disk is the projection of a 3D sphere onto 2D, and such projections are complicated by viewing angle and absorption issues. Do any of these words ring a bell?
"2D" is an interesting word, I wonder if it has ever come up on this thread before ...
Ok, start with a diameter then. Anything will do. Please, just come up with a way to differentiate between standard theory and the predictions I have made. I'm not looking for anything fancy.
All I want is the diameter of the disk according to standard theory. Is that really too much to ask?
A sphere is a three dimensional object. Those running difference graphs are two dimensional renderings of mathematical calculations based on comparisons between sequences of thermal data gathered over a period of time.
And the circumference of the Sun is still about 4.37 million kilometers.
All I want is the diameter of the disk according to standard theory. Is that really too much to ask?
The diameter of the Sun is about 1,391,000 kilometers, or in miles that's about 864,000. Is it too much to ask that you Google these things yourself?
So you are now publicly prepared to wager your hair on that lower figure, + 1200KM? Just to be generous I'll give you anything above (larger than) the photosphere. Deal?
Believe it or not, the following story says something important about RD images.Dear Mr. Spock,
Since you were so kind to give GM a hand on his last project about how far GM thinks I can see into the atmosphere, and you obviously have the angle stuff down pat, could you please be so kind as to help him again with his RD image project? He seems to be the resident expert on things related to RD images so the two of you should be able to work out something.
A little more than three times its diameter.I just want to know what you think the circumference of the RD sphere will be.

About that "transparent layer" in the SDO picture . . . I got to thinking about what such a thing would look like, and it seemed to me that the bottom of the band should look different from the top of the band. After all we're looking through far more gas at the bottom of the green band than at the top of the green band.
So I threw together a little code to model the sun as a series of nested spherical shells with various opacities and emissivities, jiggled the numbers to get something vaguely like the SDO image, and I got a significant brightness gradient (2nd image). I'm not seeing any such gradient in the SDO image (1st image), and the only reason the gradient isn't stronger in my model is that I assumed a uniform density within each layer.
So, if we're looking through a nearly transparent layer at the limb in the SDO image, why isn't there a gradient?
In Michael's fictional conjecture that is a non issue.
Yeah, I know.
MM's taking the position that he can see a transparent layer in the SDO image, and therefore any model that doesn't allow a transparent layer must be wrong. Others have argued that you can't tell that it's a transparent layer from the SDO image (true) and that we have good reason to believe that a transparent layer can't be there (also true). I'm taking the more head-on approach that the green strip in the SDO image isn't a transparent layer because it doesn't actually look like a tranparent layer.
I'm not optimistic. But it was kind of an interesting project.
Believe it or not, the following story says something important about RD images.
A mathematician and a solar physicist had drunk too many math bunnies. "The reason people don't appreciate physics is that you guys do such a lousy job of teaching math. Excuse me a minute."
While he was gone, the mathematician waved a couple of sawbucks at the waitress and said, "These are yours if, when my friend comes back, you'll answer my question exactly as I tell you."
"Mmm...what do I have to say?"
"One third x cubed."
"One third eggs cubed?"
"One third x cubed. And don't say another word after that."
"Okay."
When his friend came back, the mathematician suggested he had been underestimating the intelligence of the general public. "Why, I'll bet you a hundred dollars our waitress knows a little calculus. Wanna find out?"
"You're on."
They called her over and the mathematician asked, "What's the integral of x squared dee x?" The waitress looked surprised and bit her lip. The physicist laughed.
The waitress glared, said "One third x cubed," and stormed off to the bar. The bartender slid over to ask what was wrong. "I know it won't sound like much, but...that idiot over there made me leave out the constant!"
RD images leave out the constant.
A little more than three times its diameter.
") That was definitely worth $10. to me. I'll even throw in a beer if we ever meet up.
That was definitely worth $10. to me. I'll even throw in a beer if we ever meet up. Ok, that is *finally* a quantified prediction and we can clearly tell the difference between standard theory and a Birkeland model. I appreciate you efforts Mr. Spock. You're redeemed.
So I threw together a little code to model the sun as a series of nested spherical shells with various opacities and emissivities, jiggled the numbers to get something vaguely like the SDO image, and I got a significant brightness gradient (2nd image). I'm not seeing any such gradient in the SDO image (1st image), and the only reason the gradient isn't stronger in my model is that I assumed a uniform density within each layer.
 !): It is thermodynamically impossible since it must be at a temperature of at least 9400 K (as measured within the photosphere) and so be a plasma. This has been pointed out to MM many times over the years. Here are some of the explanations given to him that he continues to not be able to understand:
 !?
!?We have yes and so we can.http://www.thesurfaceofthesun.com/images/20050527-0713.JPG
http://www.thesurfaceofthesun.com/images/20050527-0713.JPG
http://www.thesurfaceofthesun.com/images/20050527-1313.JPG
Those are three separate RD images (from NASA). You can't see a sphere and a figure out a circumference?
This Atmospheric Imaging Assembly page lists the 10 channels.The Atmospheric Imaging Assembly images the solar atmosphere in multiple wavelengths to link changes in the surface to interior changes. Data includes images of the Sun in 10 wavelengths every 10 seconds.
 ) and predicts absolutely nothing just makes it a joke. See the over 60 questions that Michael Mozina is incapable of answering.
About that "transparent layer" in the SDO picture . . . I got to thinking about what such a thing would look like, and it seemed to me that the bottom of the band should look different from the top of the band. After all we're looking through far more gas at the bottom of the green band than at the top of the green band.
So I threw together a little code to model the sun as a series of nested spherical shells with various opacities and emissivities, jiggled the numbers to get something vaguely like the SDO image, and I got a significant brightness gradient (2nd image). I'm not seeing any such gradient in the SDO image (1st image), and the only reason the gradient isn't stronger in my model is that I assumed a uniform density within each layer.
So, if we're looking through a nearly transparent layer at the limb in the SDO image, why isn't there a gradient?
Yes.Ok, so can we at least agree on some minimum and maximum parameters to falsify both solar models?
I will accept that the maximum RD disk size in my solar model can be no larger the bottom of the chromosphere with a minimum size of the core (0), likewise the minimum distances related to the standard model should be the chromosphere to infinity. These are the minimum and maximum of each models. Does anyone disagree?
) and predicts absolutely nothing just makes it a joke. See the over 60 questions that Michael Mozina is incapable of answering.If it's time for the lurkers to kick in, I will agree and say that this thread has been very educational. Although MM's knowledge of math and physics seems to be even less than my own casual knowledge, the responses to his woo have been terrific.
Whoosh.

