Michael Mozina
Banned
- Joined
- Feb 10, 2009
- Messages
- 9,361
Actually RC, the RD image disk diameter makes or breaks both models. Only one is left standing, and I know for a fact it won't be the standard solar model. I've seen the light.
Actually Michael Mozina, the RD image disk diameter makes or breaks both models. Only one is left standing, and I know for a fact it won't be the Michael Mozina fantasy*. I've seen the basic physics thgat Michael Mozina is ignorant of.Actually RC, the RD image disk diameter makes or breaks both models. Only one is left standing, and I know for a fact it won't be the standard solar model. I've seen the light.
 ) and predicts absolutely nothing just makes it a joke. See the over 60 questions that Michael Mozina is incapable of answering.
I've seen the light.

Read it again. It'll come to you.Actually his answer does seem to set minimum and maximum parameters and that seems to be a start.
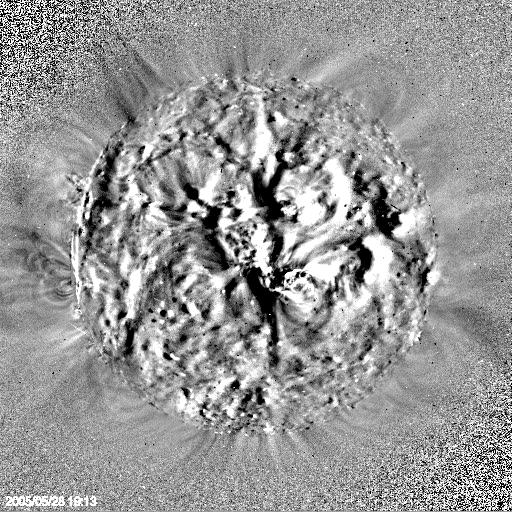
Running difference images made from the color separated pairs of images above wouldn't show much contrast because the source images are only 10 frames apart. But with a 100 frame offset the running difference images would be what you see in any single frame from the videos below.
This first video was made by removing the green and blue from the source video leaving just the red. Then all the red was converted to grayscale. Then two frames are taken from the video 100 frames apart starting with frames 1 and 100. Then 50% gray is added to each pixel in the first image, and the second image is subtracted pixel by pixel from the first. The result becomes frame 1 in the output. Then move to frame 2 and frame 102 and repeat with all frame X and frame X+100... (These pixel values are numerical values of gray from 0 = black to 255 = white.)
Then of course these videos are sized down to 640x320 and letterboxed to 640x480 to make them fit YouTube and common video viewers. And I trimmed them down to just the first 20 seconds to make more reasonable download sizes.
The second video, above, is the same only I took out the red and the blue, leaving only the green from the original video. And the third, below, is the running difference video made from just the blue. I believe these red, green, and blue colors represent 211Å, 193Å, and 171Å source data respectively.
I use a proprietary script I wrote myself to do this processing, so I won't be more specific. Anyone with a little math background, a modicum of expertise in computer video and graphics, and some reasonable programming skills could certainly do this.
This is a very important point for this discussion. Although the running difference material we find at NASA and LMSAL probably is made pretty much exactly the way I've done it, they can look quite different by adjusting only a couple of things.
First, if you subtract frame x+1 from frame x+100 you get the videos we see above. If you instead subtract frame x+100 from frame x+1 you end up with something that looks like a negative of that video. Either the lighting comes from the other side of the mountain or your mountain turns into a valley. Take your pick.
Second, the contrast between images will obviously be affected by the offset, or how many frames apart you use for the compared images. And you need to remember that is based on the time difference between the original frames, too. A running difference video made with an offset of 10 frames might show so little change that it would look almost like a smooth gray throughout. Compare images 100 frames apart and you can see the changes between source images more clearly. You can shrink and grow your mountains by comparing frames closer or further apart in the sequence.
Many of the running difference images available from NASA and LMSAL have quite different sizes of mountains, some so huge that it's amazing we don't see them with the naked eye when there's a solar eclipse!")
Those are all different wavelengths emitted particularly strongly by ultrahot iron at different temperatures. 171 is particularly strong from 600,000K iron, 193 picks up two lines (one characteristic of 1,200,000K and one of 5,000,000K) and 211 picks up 2,000,000K. At any high enough temperature, all of these lines will be emitted, but the balance between them shifts in the way I said.
The orange? If you ovelaid a visible-light image of the Sun on this, those "orange" areas are above the surface. That's the corona. At the place it meets the green edge, there's about ONE PIXEL worth---a few hundred km in projection---of either lightening of the orange or darkening of the green or both---which is entirely buried in the JPEG artifacts. Is that what you think is "limb darkening", Michael? That one sometimes-darker row of pixels? Good heavens.
If that one row of pixels were to mean something (for example, if it's still there in a FITs image, and if it's wider than the telescope PSF), it's a perfectly normal standard model meaning. That's what you expect if there's a layer ~400km thick, above the green emitter and below the orange emitter, which emits neither green nor orange. Or alternatively it's what you expect if there's an extremely optically-thin layer (O = 0.001 or so) above the green emitter which is able to absorb the green light when it's in extreme projection.
Is that one row of pixels the exciting one, Michael?
About that "transparent layer" in the SDO picture . . . I got to thinking about what such a thing would look like, and it seemed to me that the bottom of the band should look different from the top of the band. After all we're looking through far more gas at the bottom of the green band than at the top of the green band.
So I threw together a little code to model the sun as a series of nested spherical shells with various opacities and emissivities, jiggled the numbers to get something vaguely like the SDO image, and I got a significant brightness gradient (2nd image). I'm not seeing any such gradient in the SDO image (1st image), and the only reason the gradient isn't stronger in my model is that I assumed a uniform density within each layer.
So, if we're looking through a nearly transparent layer at the limb in the SDO image, why isn't there a gradient?
There are mass flows (coronal loops) flowing all along the surface. It's *highly* electrically active. Those jagged areas are mass flows related to either coronal loops or twister like formations that form in the atmosphere.
Is there anyone that disagrees with the minimums and maximums that I have outlined related to diameter of the disk in the RD images?
Is GM prepared to commit his hair yet on anything with a number attached?
Ok, that is *finally* a quantified prediction and we can clearly tell the difference between standard theory and a Birkeland model. I appreciate you efforts Mr. Spock. You're redeemed.")
Ok, so can we at least agree on some minimum and maximum parameters to falsify both solar models?
I will accept that the maximum RD disk size in my solar model can be no larger the bottom of the chromosphere with a minimum size of the core (0), likewise the minimum distances related to the standard model should be the chromosphere with a maximum of infinity. These are the minimum and maximum of each models. Does anyone disagree?
Speak up now if you disagree.
Under? What's this "under"? It's a 2-D photo. Either you're seeing it closer to the center of the photo, or closer to the edge. Please stick to that terminology---"under" is your intuitive interpretation which you haven't been able to justify at all---in part because your descriptions are maddeningly unclear, mixing bits of observable ("green") with bits of your guesswork ("under", "through") in a totally hashwork way.
Fix it. Here's an ASCII art cartoon of a SIDE VIEW of a simple opaque Sun with a green blob hovering in front of it. I've labeled (with letters) a bunch of lines-of-sight for an observer looking down at and past the limb. You can follow any given line of sight and figure out what the observer sees in that pixel. This is possible both for opaque features and transparent ones---I put in an example "g" to show. Then I gave you an ASCII "stem plot" where you can list what's in line-of-sight a, what's in line-of-sight b, what's in line-of-sight j, etc.
Please edit it to represent what YOU think the 3D structure is, and show how you think that 3D structure projects along the lines-of-sight. Replace the opaque 0s with "f" or "n" to represent iron or neon, for example.
Code:observer is up here lines of sight, looking down. |||||||||| abcdefghij This is a cartoon of a simple opaque sphere. The 0s are "opaque photospheric material". The "g" for example is a blob of transparent corona. 0 g What do we see along the lines of sight a-h? 000 g a: 0 0000 g b: 0 00000 c: 0 000000 d: 0 000000 e: 0 <- when you look at an opaque sphere you 0000000 f: 0 see the same thing right out to the edge. 0000000 g: 0+g <- when you're looking through the green blob 0000000 h: 0+g you see green + whatever's behind it. 00000000 i: b+g 00000000 j: b <- past the edge all you see is the background 00000000 which is "b" for black. 00000000 00000000 00000000 0000000 0000000 0000000 000000 000000 00000 0000 000 0 bbbbbbbbbbbb background is black bbbbbbbbbbbb bbbbbbbbbbbb
First, you haven't defined what you mean by "RD disk size".

Why does this RD debate continue? As GeeMack says, "A running difference image is a simple graph representing differences in thermal characteristics over time." I think I understand what that means. So, how can such an image show any fixed features?
Because Mozina is an idiot? Because the gathered throng wants to humor him? My post on the topic has already fallen to the previous page, but allow to to quote myself in full from last night ...Why does this RD debate continue?
The Solar Radius and Limb Brightening in the EUV during Cycle XXIII
12th European Solar Physics Meeting, Freiburg, Germany, held September, 8-12, 2008
The Solar Radius in the EUV during Cycle XXII
Astronomy and Astrophysics 476(1): 369-372, December II 2007
The meeting poster and the published paper are essentially duplicates of each other. I was able to download the PDF of the former with no problems, while the latter has a PDF via arXiv.
Abstract (common to both): We have determined the solar transition region and coronal radius at EUV wavelengths and its time evolution during Solar Cycle XXIII using daily 30.4 and 17.1 nm images obtained by the Extreme Ultraviolet Imager (EIT) aboard the SoHO satellite. The radius was obtained by fitting a circle to the limb brightness ring. The weighted mean of the temporal series gives (967''.56 ± 0''.04) and (969''.54 ± 0''.02) at 30.4 and 17.1 nm respectively. No significant correlation was found with the solar cycle at neither of the two wavelengths. Since the temperature formation of the 30.4 nm line is between (60 - 80) 103 K (Transition Region), the obtained result is greater than that derived from present optical atmospheric models. On the contrary, this height is compatible with radio models. We also present results of the limb brightening time evolution.
Note that the shorter wavelength (17.1 nm = 171A) gives a slightly but significantly larger radius. Also note that both are larger than the optical radius. The optical radius is the photosphere and the 30.4 & 17.1 nm radii are in the transition region, which is seen to be above the photosphere. No surprise here, since we already know from a few decades of direct observation that the transition region is above the photosphere.
Since the total extent of Michael's quantitative descriptions are based on staring at pictures and counting pixels, I think he'd rather avoid the actual measurements of the Sun and its parts, and stick to sizes measured in pixels. His argument so far doesn't appear to have come from doing any hard homework like, you know, looking up the size of the Sun on Google.
It's worth mentioning here that even in our largest, best resolution solar images to date, those coming in from the SDO with the diameter of the Sun scaled to over 3200 pixels across, the thickness of the photosphere, in scale, is just about a single pixel. The Sun is typically measured to have a radius of about 695,500 kilometers at the uppermost level of the photosphere. By the time you'd travel into the Sun by the distance of just one single pixel in those highest resolution images, about 430 kilometers, the solar atmosphere would have gone from transparent to opaque. Again, that change occurs across the distance of one single pixel.
Any claims made about seeing deeper in any image, like 4800 kilometers, or in the case of looking long ways through the plasma along the limb, 80,000+ kilometers, are based on ignorance, fantasy, delusion, wishful thinking, possibly even flat out lies, but are not based in any way on the state of reality where sane intelligent people dwell.
Because Mozina is an idiot? Because the gathered throng wants to humor him? My post on the topic has already fallen to the previous page, but allow to to quote myself in full from last night ...
Note that the EIT instrument on SoHO is used to measure the solar disk radius at Mozina's favorite wavelength, 171A, and the number is 969''.54 ± 0''.02. Now see this ...
On the Constancy of the Solar Diameter II; Kuhn, et al., The Astrophysical Journal 613(2): 1241-1252, October 2004
Abstract: The Michelson Doppler Imager instrument on board SOHO has operated for most of a solar cycle. Here we present a careful analysis of solar astrometric data obtained with it from above the Earth's turbulent atmosphere. These data yield the most accurate direct constraint on possible solar radius variations on timescales from minutes to years and the first accurate determination of the solar radius obtained in the absence of atmospheric seeing.
Download the PDF and look at table I, a list of solar disk radius measurements spanning 1979 - 2004. They are all between 960''.52 and 958''.54. And see the last page of the paper, where the authors determine a SoHO MDI radius 959''.28 (all are normalized to a standard distance of 1 AU).
What Mozina wants to do has already been done, and with far greater accuracy & precision that his RD diddling could ever hope to achieve. It has already been determined that the solar disk radius at 171A (transition region - chromosphere) is roughly 10 arcseconds larger than the optical (photospheric) radius. At a distance of 1 AU that angular measure translates into 7253 km, assuming I have done the conversion correctly. So there is in fact nothing to debate. It has all been done already and the Mozina model is the loser, as one would naturally expect.
The MDI instrument images the photosphere in the 6767.8 Angstrom Ni I (that's neutral, non-ionized Nickel) absorption line. That's slightly redder than the eyeball center wavelength of about 5500 Angstroms, in the rough eyeball range 4000 - 7000 Angstroms (with much variation between individual eyes). So there is no doubt that it is sensitive to the eyeball photosphere "surface", where the effective temperature is around 5800 Kelvins.
I would like to adopt Clinger's prediction as my own. I'm willing to wager on it, whatever terms you like. Money, eyebrows, whatever. Just name it.
You in?
So if the disk fits inside the chromosphere, you'll agree I'm right?It can't. For several reasons. One, it's just a graph, like a pie chart or a bar graph. Two, the data used to create it comes from thousands of kilometers above where Michael claims to see his mythical solid iron surface. And three, because several branches of science applied to solar research show that the solid iron surface Michael sees can not possibly exist according to the laws of physics.
No, I'm taking W.D. Clinger's position from this post:For you it will just cost you your public change of position. I only want GM's hair.
This *SHOULD* be a no brainer. There's no possible way according to standard theory that the RD outline of the sphere will fit inside the chromosphere. It would defy all the laws of physics according to you. Do we have a bet?
No, I'm taking W.D. Clinger's position from this post:
http://www.internationalskeptics.com/forums/showthread.php?postid=5886932#post5886932
His estimate of the circumference of the RD sphere is what I am betting on. You already stated that this would differentiate the standard model from your model.
If it turns out that Clinger is wrong, I will publicly and humbly change my position using the most abjectly apologetic terms that I can. You might say that I will eat some humble...pie.
Well, as I see it, essentially the bet boils down the edges of the RD image in relationship to the chromosphere. Anything outside off that smooth inside surface falsifies my model. Anything inside of it falsifies standard theory. Is that acceptable to you? In other words I don't care about the distance if it's "outside" the chrmosophere boundary, but if it's under (generally where I say it is), then I win.
I have already committed myself to shaving my head bald assuming GM has intestinal fortitude to put his hair where his mouth is). I am prepared to post a picture of me bald and eat some humble pie either way. I sure wish GM would just get off the fence and make this fun.
a) Helloooo? There IS a way in the standard theory. I explained it nine times. Did you forget?
b) Your image analysis "skills" seem not to be able to tell the difference between a bright band and a dark band. What bright/dark pattern---if any---are you planning to use to identify an "edge"?
c) Is there something wrong with the (published, peer-reviewed, not-based-on-PR-JPEGs-analyzed-by-confirmation-bias) SOHO paper we just saw?
Since the total extent of Michael's quantitative descriptions are based on staring at pictures and counting pixels, I think he'd rather avoid the actual measurements of the Sun and its parts, and stick to sizes measured in pixels. His argument so far doesn't appear to have come from doing any hard homework like, you know, looking up the size of the Sun on Google.
Your theory would explain how a RD image disk will fit inside of the chromosphere? I must have missed that one. Try one more time to explain that to me.
Wang et al. (Abstract) said:In this paper, we present an automated system, which has the capability to catch and track solar limb prominences based on observations from EUV 304 passband. The characteristic parameters and their evolution, including height, position angle, area, length and brightness, are obtained without manual interventions. By applying the system to the STEREO-B/SECCHI/EUVI 304 data during 2007 April -2009 October, we obtain a total of 9477 well-tracked prominences and a catalog of these events available online at this http URL A detailed analysis of these prominences suggests that the system has a rather good performance. We have obtained several interesting statistical results based on the catalog. Most prominences appear below the latitude of 60 degrees and at the height of about 26 Mm above the solar surface. Most of them are quite stable during the period they are tracked. Nevertheless, some prominences have an upward speed of more than 100 km/s, and some others show significant downward and/or azimuthal speeds. There are strong correlations among the brightness, area and height. The expansion of a prominence is probably one major cause of its fading during the rising or erupting process.
Because Mozina is an idiot? Because the gathered throng wants to humor him? My post on the topic has already fallen to the previous page, but allow to to quote myself in full from last night ...
Note that the EIT instrument on SoHO is used to measure the solar disk radius at Mozina's favorite wavelength, 171A, and the number is 969''.54 ± 0''.02. Now see this ...
On the Constancy of the Solar Diameter II; Kuhn, et al., The Astrophysical Journal 613(2): 1241-1252, October 2004
Abstract: The Michelson Doppler Imager instrument on board SOHO has operated for most of a solar cycle. Here we present a careful analysis of solar astrometric data obtained with it from above the Earth's turbulent atmosphere. These data yield the most accurate direct constraint on possible solar radius variations on timescales from minutes to years and the first accurate determination of the solar radius obtained in the absence of atmospheric seeing.
Download the PDF and look at table I, a list of solar disk radius measurements spanning 1979 - 2004. They are all between 960''.52 and 958''.54. And see the last page of the paper, where the authors determine a SoHO MDI radius 959''.28 (all are normalized to a standard distance of 1 AU).
What Mozina wants to do has already been done, and with far greater accuracy & precision that his RD diddling could ever hope to achieve. It has already been determined that the solar disk radius at 171A (transition region - chromosphere) is roughly 10 arcseconds larger than the optical (photospheric) radius. At a distance of 1 AU that angular measure translates into 7253 km, assuming I have done the conversion correctly. So there is in fact nothing to debate. It has all been done already and the Mozina model is the loser, as one would naturally expect.
The MDI instrument images the photosphere in the 6767.8 Angstrom Ni I (that's neutral, non-ionized Nickel) absorption line. That's slightly redder than the eyeball center wavelength of about 5500 Angstroms, in the rough eyeball range 4000 - 7000 Angstroms (with much variation between individual eyes). So there is no doubt that it is sensitive to the eyeball photosphere "surface", where the effective temperature is around 5800 Kelvins.
Michael Mozina;5888642 ... said:This *SHOULD* be a no brainer. There's no possible way according to standard theory that the RD outline of the sphere will fit inside the chromosphere. It would defy all the laws of physics according to you. Do we have a bet?

Originally Posted by Tim Thompson
...
Note that the EIT instrument on SoHO is used to measure the solar disk radius at Mozina's favorite wavelength, 171A, and the number is 969''.54 ± 0''.02. Now see this ...
On the Constancy of the Solar Diameter II; Kuhn, et al., The Astrophysical Journal 613(2): 1241-1252, October 2004
Abstract: The Michelson Doppler Imager instrument on board SOHO has operated for most of a solar cycle. Here we present a careful analysis of solar astrometric data obtained with it from above the Earth's turbulent atmosphere. These data yield the most accurate direct constraint on possible solar radius variations on timescales from minutes to years and the first accurate determination of the solar radius obtained in the absence of atmospheric seeing.
Download the PDF and look at table I, a list of solar disk radius measurements spanning 1979 - 2004. They are all between 960''.52 and 958''.54. And see the last page of the paper, where the authors determine a SoHO MDI radius 959''.28 (all are normalized to a standard distance of 1 AU).
What Mozina wants to do has already been done, and with far greater accuracy & precision that his RD diddling could ever hope to achieve. It has already been determined that the solar disk radius at 171A (transition region - chromosphere) is roughly 10 arcseconds larger than the optical (photospheric) radius. At a distance of 1 AU that angular measure translates into 7253 km, assuming I have done the conversion correctly. So there is in fact nothing to debate. It has all been done already and the Mozina model is the loser, as one would naturally expect.
The MDI instrument images the photosphere in the 6767.8 Angstrom Ni I (that's neutral, non-ionized Nickel) absorption line. That's slightly redder than the eyeball center wavelength of about 5500 Angstroms, in the rough eyeball range 4000 - 7000 Angstroms (with much variation between individual eyes). So there is no doubt that it is sensitive to the eyeball photosphere "surface", where the effective temperature is around 5800 Kelvins.
Just wanted to say this thread is awesome.
I want to say thank you, Michael. Without all your crazy I would never have gotten such a good education from those with actual knowledge of the subject, and would instead be prone to accept fantasies such as the one you beleive.
And a big thank you to the following posters for putting the "E" in JREF:
sol invictus
dasmiller
Dancing David
ben m
W.D. Clinger
And I'm sure I've missed some, and if I have I apologize. There's been so much good info posted I can't keep track of everyone. I'm tempted to giggle like a schoolgirl