dasmiller
Just the right amount of cowbell
Yes. We've discovered that Jupiter has a solid iron surface!
Well done, sir!
Yes. We've discovered that Jupiter has a solid iron surface!
Cool!Yes. We've discovered that Jupiter has a solid iron surface!
(Or maybe this just goes to show that only a true dyed-in-the-wool crackpot would fall for the optical illusion created by the dark light pixel arrangement in a running difference graph.)
")
Yes. We've discovered that Jupiter has a solid iron surface!
(Or maybe this just goes to show that only a true dyed-in-the-wool crackpot would fall for the optical illusion created by the dark light pixel arrangement in a running difference graph.)
Au contraire, mon ami. The Mozina model of the sun has consistently failed each & every physical test to which it has ever been subjected, with no exceptions. The Mozina model consistently & always violates the laws of physics, and in fairly obvious fashion I might add, whereas the standard physical model of the sun has been quite a rousing success. There is more than ample information to be found in this thread alone to support my assertions made here.You have consistently failed to judge this solar model based on it's specifications. The irony of course is that it was the SSM that has been shown to be in violation of the laws of physics, not my model.
There is no observational evidence to support a "highly ionized" photosphere on the sun. Your claims that there is observational evidence hinge on your rather foolish attempt to physically interpret a feature found in a press release image, later authoritatively identified as an artifact of the process by which the image was created. Your model fails the simplest tests quite badly, whereas the standard physical model of the sun survives quite comfortably.My model "predicts" light can come up and through a highly ionized atmosphere. It's your solar model that flunked the physics test.
I do not ignore the images and neither does anyone else. Indeed, why would I ignore the images, since the images definitively reject your model? It is your interpretation of the images, and not the images themselves, which the entire civilized world rejects. We all reject your interpretation of the images because your interpretation significantly violates the laws of physics, and because your interpretation is at odds with even the simplest, child level understanding of the viewing geometry.Decades of limited resolution and capability just got overturned in SDO images Tim. You seem to be ignoring the images entirely. LMSAL put the transition region in the wrong place Tim, just as I've said now for 5 years.
When did your solar theory begin predicting that? until now, you have been insisting that the transition region is under the photosphere, not the chromosphere. By the way, the standard physical model of the sun puts the transition region under the chromosphere, not inside it.That transition region denoted by the limb dimming is located under the chromosphere, not inside of it, just as my solar theory predicts.
http://aia.lmsal.com/public/firstlight.html
http://aia.lmsal.com/public/firstlight/20100408_044515/f_211_193_171.jpg
http://aia.lmsal.com/public/firstlight/20100408_013015/f_094_335_193.jpg
http://aia.lmsal.com/public/firstlight/20100408_013015/f0193.gif
I defy you to find any iron ion wavelength in SDO that doesn't have a bright horizon line, and underneath of that bright line, an opaque limb. In fact I defy you to find any TRACE high resolution image of the limb that doesn't also show that same "feature". That is not an "artifact" Tim, it's in *EVERY* iron ion limb image of the sun.
One more example of the amateur approach to image processing. One must approach the "pixel level" with caution. The pixels on the AIA detector project onto the sky with angular size 0.6 arcseconds. I can't find the assumed or measured point spread function (PSF), but if it is Nyquist sampled (as is usually the case), then the PSF is likely about twice that, or 1.2 arcseconds in diameter. In the absence of resolution enhancement, one should never trust the physical reality of anything in an image that is smaller than the point spread function (which is the smallest physical unit that can be detected by the optics), or more appropriately the point response function (which is the convolution of the point spread function of the optics and the detector pixel).You really need to get into the image at the pixel level to see these details, ...
Yes. We've discovered that Jupiter has a solid iron surface!
(Or maybe this just goes to show that only a true dyed-in-the-wool crackpot would fall for the optical illusion created by the dark light pixel arrangement in a running difference graph.)

The feature you are talking about in that image is a bright green band below the limb of the sun. That feature has been authoritatively identified as an artifact of the image creation process, by the people who actually created the image. End of story.
Mozina:
You do not have a "theory." A scientific theory is developed by people who understand scientific methods and scientific data.
One more example of the amateur approach to image processing.
There is no observational evidence to support a "highly ionized" photosphere on the sun.
I do not ignore the images and neither does anyone else.
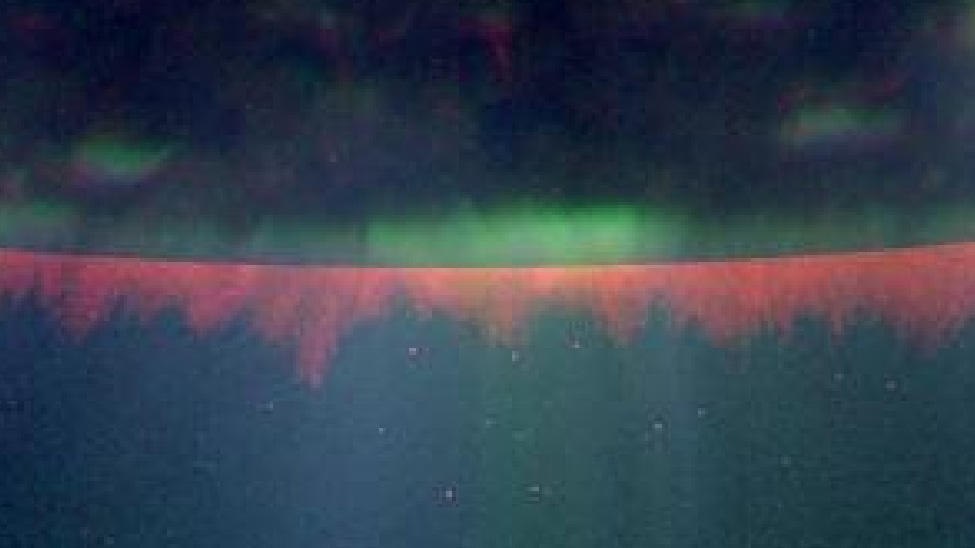
That green light all around the limb defies the predictions of the SSM. It is not supposed to be there. The notion that limb dimming is some sort of "artifact" is absurd.
Take a picture of a ball.
Make a mark on the picture, just below the limb of the ball.
Hold the ball oriented just the same as it is in the picture.
Make a mark on the ball that matches the mark on the picture.
Is the mark on the ball under the surface of the ball?
No, the mark on the ball is on the surface of the ball.
The mark on the 2-dimensional picture appears just below the limb of the ball.
The mark on the 3-dimensional real ball appears on the part of the surface of the ball that is extended towards you as you look at it.
Birkeland would be horrified to be associated with your fantasy* of a iron crust....Birkeland's theory....
 ) and predicts absolutely nothing just makes it a joke. See the over 60 questions that Michael Mozina is incapable of answering.
This was in reply toI was disappointed to be sure. There simply was not the resolution necessary IMO to make a convincing case. Thanks to SDO that has all changed.
Originally Posted by Michael Mozina - 02/09/2006
[Skeptic Friends Network]: I hear you on that point. I've already stuck my neck *WAY* out on a limb with the STEREO program. I'm betting the farm that they'll "discover" that the 171A, 195A, and 284A image originate *underneath* the photosphere, not above it. That's a real falsification mechanism that I'll accept as a viable way to determine which "interpretation" is accurate, and there should not be much room for error. I'm going to pay close attention to that data, I assure you. I'm interesting in both proving my case and also in falsifying it as well.
 !): It is thermodynamically impossible since it must be at a temperature of at least 9400 K (as measured within the photosphere) and so be a plasma. This has been pointed out to MM many times over the years. Here are some of the explanations given to him that he continues to not be able to understand:
 !?
!?http://aia.lmsal.com/public/firstlight/20100408_013015/f0193.gif
Which part of that image image does not experience limb dimming Tim? Name the position on the clock where you *DO NOT* find that "feature"?
This point has been made before, many times no doubt, but it's worth repeating.This iron crust within the Sun idea of Micheal Mozina is very easy to disprove (big surprise
This alone makes his idea into a complete fantasy and his continued belief with it a delusion and so we could stop there but... The continuous issuing of unsupported assertions, displays of ignorance of physics and fantasies about what he imagines in images are illustrated in this list of unanswered questions. The first question was asked on 6th July 2009.
- Is your solid iron surface thermodynamically possible? First asked 8 July 2009. See this post for a fuller explanation of the thermodynamic problems with MM's solid iron surface.
- Why this iron crust is thermodynamically impossible
- Iron Sun Surface Thermodynamically Impossible IV
Micheal Mozina has a habit of essentially labeling Kristian Birkeland as having no knowledge of physics, e.g. the simple thermodynamics that make an iron crust impossible.
- What is the amount of 171A light emitted by the photosphere and can it be detected?
- What discharge rates and processes come from your hypothetical thermodynamically impossible solid iron surface to show up as records of change in the RD animation in the corona.
- Where is the the solar wind and the appropriate math in Birkeland's book?
- Please cite where in his book Birkeland identified fission as the "original current source"
- Please cite where in his book Birkeland identified a discharge process between the Sun's surface and the heliosphere (about 10 billion kilometers from the Sun).
- Coronal loops are electrical discharges?
- Can Micheal Mozina answer a simple RD animation question?
- More questions for Michael Mozina about the photosphere optical depth
- Formation of the iron surface
- How much is "mostly neon" MM?
- Just how useless is the Iron Sun model?
- Coronal loop heating question for Michael Mozina
- Coronal loop stability question for Michael Mozina.
- Has the hollow Iron Sun been tested?
- Is Saturn the Sun?
- Question about "streams of electrons" for Micheal Mozina
- What is the temperature above the iron crust in the Iron Sun model?
- What part of the Sun emits a nearly black body spectrum with an effective temperature of 5777 K?
- Is the iron surface is kept cooler than the photosphere by heated particles?
- Entire photon "spectrum" is composed of all the emissions from all the layers
- Same event in different passbands = surface of the Sun moves?
- Why neon for your "mostly neon" photosphere?
- Where is the "mostly fluorine" layer?
- What is your physical evidence for "mostly Li/Be/B/C/N/O" layers?
- What is your physical evidence for the "mostly deuterium" layer?
- Explain the shape of your electrical arcs (coronal loops)
- What is your physical evidence for the silicon in sunspots?
- How do MM's "layers" survive the convection currents in the Sun?
- Where are the controllable empirical experiments showing the Iron Sun mass separation?
- How can your iron "crust" not be a plasma at a temperature of at least 9400 K?
- How can your "mountain ranges" be at a temperature of at least 160,000 K?
- Where is the spike of Fe composition in the remnants of novae and supernovae?
- Which images did you use as your input for the PM-A.gif image, etc.?
- Where did your "mountain ranges" go in Active Region 9143 when it got to the limb?
- Do RD movies of inactive regions show "mountain ranges"?
- Just how high are your "mountain ranges"?
- How does your iron crust exist when there are convection currents moving through it?
- Why does the apparent height of your "mountain ranges" depend on the timing of source images for the RD process when the light sources and mountains in the images are the same?
- Why does the lighting of your "mountain ranges" move depending on the RD process?
- Why are the coronal loops in the RD images aligned along your "mountain ranges" rather than between them as expect fro electrical discharges?
- Why are the sunspot umbra not "mostly" iron plasma (Fe was also detected by SERTS as was C and a dozen more elements)?
- Can you show how you calculated that "3000-3750 KM" figure for the photosphere depth?
- How did you determine that the filaments "abruptly end right there"?
- Citation for the LMSAL claim that coronal loops all originate *ABOVE* the photosphere?
- Citation for Birkeland's prediction for the speed of the solar wind
- How did you measure the curvature of penumbral filaments in the Hinode images?
- How does your Iron Sun fantasy create the observed magnetic field of the Sun?
- Calculation for the depth of the SOT_ca_061213flare_cl_lg.mpg filament?
- Can you understand that the photosphere is defined to be opaque?
- A comment on MM's ability to interpret images: No little plasma (penumbral) filament!
- Where has any one in this thread claimed that the umbra is 2D?
- Is Michael Mozina's claim of measuring the curvature of the filaments true?
- Do you understand how fluorescent tubes ("neon bulbs") work?
- Can you explain why limb darkening does not diisprove your model?
- Why is the SERTS data on the corona applicable to sunspots?
- Please define a "current carrying plasma" from a textbook.
- How does the SERTS data show that all of the neon and silcon in the Sun's atmosphere is highly ionized?
- Where is the solar model that predicts the SDO images in Birkeland's book? (really a follow on to questions dating from July 2009)
- Where does the current from your impossible iron crust come from?
- Did you cherry pick the SDO image to support your fantasy? - the answer is yes. MM saw a "green line" in one PR image and ignored its absence in another.
The SDO image"green line" is a processing artifact as confirmed by the NASA team.
But anyway
What went wrong with your counting of pixels in the SDO image?
Where are your calculations that the SDO artifact has a width of *EXACTLY* 4800 km- This post deserves mentioning: Math Bunnies & Image Bunnies
- Can Micheal Mozina understannd simple geometry?
- What is wrong with W.D.Clinger's calculation?
Two recent questions but I fully expect the MM will be able to refute the geometry textbooks- Got numbers, Michael Mozina? or What real quantified predictions come from Michael Mozina's Iron Sun fantasy? Is MM's idea complete useless
- Can you cite the paper where Kosovichev states that "those loops are mass flows" (coronal loops?)?
- Are galaxies electrical discharges from magnetized iron spheres (Birkelands "nebulae model")?
- How can we detect the less than 1 photon per year from your iron crust?
- Can you understand that the disk radius in RD images depends on solar activity?
- Will you yank down your web site as promised after your prediction failed?
- Why are you still ignoring that measurements show the chromosphere, etc. above the photosphere?
(this happens to be one reason why MM is called a crank)
Not really a question, just a list of the symptoms of a crank or crackpot that MM displays
Does this difference tell us anything about a fundamental difference in how MM perceives science?
DRD is absolutely correct about one thing, there appears to be a fundamental philosophical difference between how the astronomy industry as a whole approaches astronomy and how I approach that topic or any scientific topic for that matter.
<snip>
You folks however have a philosophical, emotional, and actually a professional “need” to quantify anything and everything that you see in space, regardless of the empirical validity of your theories, and regardless of how well they actually jive with the observations. You’re definitely headed for a scientific disaster as I see things.
Well, that would leave out this crew IMO. "Dark energy" isn't a "theory", nor is "inflation". These folks just "make up" whatever they like and add math. The problem here PS is that in this case the SSM has to actually pass the observation test and it does not. That green light all around the limb defies the predictions of the SSM. It is not supposed to be there. The notion that limb dimming is some sort of "artifact" is absurd. Tell me which part of the clock do you *NOT* see limb dimming?
http://aia.lmsal.com/public/firstlight/20100408_013015/f0193.gif
Are you having a memory lapse? The "green light" has been revealed to be an artifact!
No, I didn't see that post.Did you see what he said here?DeiRenDopa said:Does this difference tell us anything about a fundamental difference in how MM perceives science?
Michael Mozina said:DRD is absolutely correct about one thing, there appears to be a fundamental philosophical difference between how the astronomy industry as a whole approaches astronomy and how I approach that topic or any scientific topic for that matter.
<snip>
You folks however have a philosophical, emotional, and actually a professional “need” to quantify anything and everything that you see in space, regardless of the empirical validity of your theories, and regardless of how well they actually jive with the observations. You’re definitely headed for a scientific disaster as I see things.
So Michael sees quantifying observations as a recipe for disaster, in contrast to his ("Gee, look!") style of image analysis.
Probably this thread should be moved to Religion and Philosophy, although they might object. Maybe Conspiracy Theories?
This AIA Science Plan webpage contains a wealth of information about the expected angular resolution of the AIA data. It is "~1"".One more example of the amateur approach to image processing. One must approach the "pixel level" with caution. The pixels on the AIA detector project onto the sky with angular size 0.6 arcseconds. I can't find the assumed or measured point spread function (PSF), but if it is Nyquist sampled (as is usually the case), then the PSF is likely about twice that, or 1.2 arcseconds in diameter. In the absence of resolution enhancement, one should never trust the physical reality of anything in an image that is smaller than the point spread function (which is the smallest physical unit that can be detected by the optics), or more appropriately the point response function (which is the convolution of the point spread function of the optics and the detector pixel).Michael Mozina said:You really need to get into the image at the pixel level to see these details, ...
This means that no feature smaller than 2x2 pixels is likely to be real, and you probably want something rather larger than that if you are serious. It also depends on redundancy, whether or not the image in question is a single image, or a mosaic of many strongly overlapping images. In other words, how many individual images contribute input to any given single pixel in the final image? If the answer is 1 or 2, the real pixel level is not trustworthy. If the answer is more, then it might be, but it depends critically on the image restoration technique.
The lesson here is never blindly trust any image at the level of single pixels.
Find me one iron ion wavelength in the SDO images or any limb image of TRACE that does not display that exact same "feature".
As for the green feature being in every SDO image, who cares? These are press release images, not science images. They are all created in the same way, using the same tools and same algorithms by the same group of people. Hence, common artifacts are to be expected in such images. Only the science images can tell you what is or is not physically real. Only a foolish simpleton does what you do to interpret images, and we all know what that means.An "artificact" is something that isn't really there. That limb darkening is there in every iron ion wavelength PS. Just find me one released SDO iron line image that doesn't have that "feature".
Limb observations of the sun make it possible to retrieve the temperature structure of the photosphere as a function of depth, in much the same way as limb observations of Earth's atmosphere by satellites allows us to retrieve temperature profiles for the Earth's atmosphere (see, e.g., Solar Astrophysics by Peter Foukal, Wiley-VCh 2004, chapter 5: "The photosphere"; The Observation and Analysis of Stellar Photospheres by David Gray, Cambridge University Press 2005, 3rd edition).
The physical condition of the solar photosphere is derived from observations of limb darkening, our ability to see the atmosphere of the sun projected against the empty space behind it, simply because the sun, unlike other stars, is really nearby.
Michael Mozina had already dismissed that fact:In any case, AFAIK, the images released so far are not FITS (so no one can really know what the PSF is, nor attempt to estimate it from the raw data), and even if they were, there is - is there not? - an explicit statement about them being uncalibrated!
Like they didn't think to calibrate it on the ground? I counted the whole limb RC. Even if it wasn't centered exactly, my methods would have compensated for that issue anyway. It's a smoke screen too. Nothing is going to make that green go away along the limb.
I already did that above. A TRACE image that shows the limb and does not have that green feature in it (the very first TRACE image I looked at): http://trace.lmsal.com/POD/images/T195_20060802_183218.jpg
http://aia.lmsal.com/public/firstlight/20100408_013015/f0193.gif
I guess I need to tackle this limb dimming "artifact" claim head on. One of you needs to use this image (or any iron ion SDO image) to show me where the "limb dimming" is not present. Which position on the clock does not show that jagged limb dimming feature?
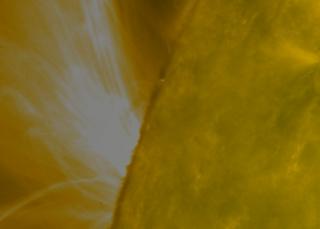
That is because the white light photosphere from one of the two channels that is sensitive to that surface was simply 'subtracted" from the HeII image. Since the white light surface is relatively smooth, so is the underside of that HeII image. Since the mass flows tend to flow up and through that point, all the mass flows coming up from the surface create those jagged edges that look like flames.
The rest of the composite image is simply the iron ion light from the sun. The green color is directly related to the colors assigned to each wavelength, and the blending of light that occurs between the various wavelengths. Whatever color scheme we select for the ions, we should see a blending of those colors along the horizon just as it becomes opaque. That's where the most light shines from each of the wavelengths (other than the active regions of course). That blending of colors is a critical clue, as is the RD outline. The RD outline is more conclusive IMO because it really leaves no room for any more doubt. If the light originates along the darkened limb lines (as it must) then the RD disk outlines must also follow that same line. The circumference of the RD image is going to match that 4800 limb darkened area, not the inside of the chromosophere as would be true if the SSM were correct.
It's not actually "absent" if you take the image apart, but I'm not publishing any more solar images EVER. I'm done. You can do it for yourself if you like. The reason it looks to be absent in that one image is because of the high amount of activity in that region that is "in front of" that part of the limb. If we simply used a 193A image, it would probably come out a lot more clear, but since they used so many different wavelengths, and there is so much light in that region, it's harder to see the border. It's possible to see it by playing around with color schemes, but like I said, I'm done publishing images that I personally created. I refuse to be called a fraud over a solar image ever again.
I'll be happy to create a host of predictions, all related to the 4800Km limb darkened region, but someone besides GM and me will have to create them.
Well, that would leave out this crew IMO. "Dark energy" isn't a "theory", nor is "inflation". These folks just "make up" whatever they like and add math. The problem here PS is that in this case the SSM has to actually pass the observation test and it does not. That green light all around the limb defies the predictions of the SSM. It is not supposed to be there. The notion that limb dimming is some sort of "artifact" is absurd. Tell me which part of the clock do you *NOT* see limb dimming?
http://aia.lmsal.com/public/firstlight/20100408_013015/f0193.gif
Sure these ions exist, in the "non opaque chromosphere". What does that have to do with anything?
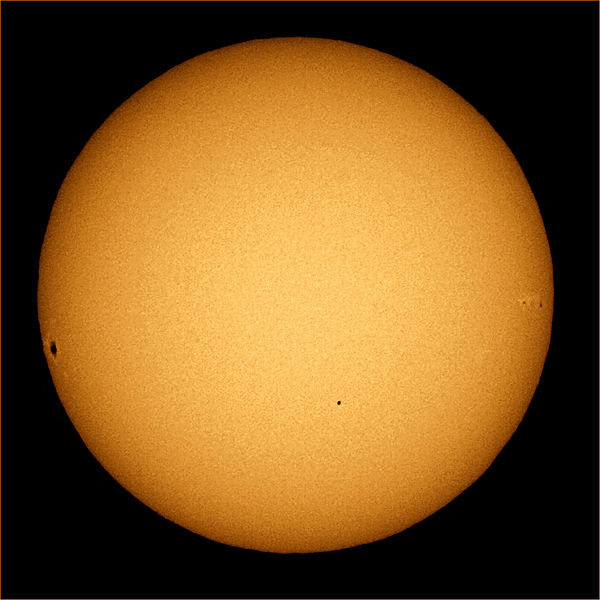
http://www.nasa.gov/images/content/447006main_fulldiskmulticolor-orig_new1_full.jpg
FYI, I've been carefully studying the limb areas from the new SDO composite iron/he II composite image. It's a real pity they didn't add one of the photosphere wavelengths to that image but due to the He chromosphere filter, it's really not even necessary.
Well, that would leave out this crew IMO. "Dark energy" isn't a "theory", nor is "inflation". These folks just "make up" whatever they like and add math. The problem here PS is that in this case the SSM has to actually pass the observation test and it does not. That green light all around the limb defies the predictions of the SSM. It is not supposed to be there. The notion that limb dimming is some sort of "artifact" is absurd. Tell me which part of the clock do you *NOT* see limb dimming?
http://aia.lmsal.com/public/firstlight/20100408_013015/f0193.gif
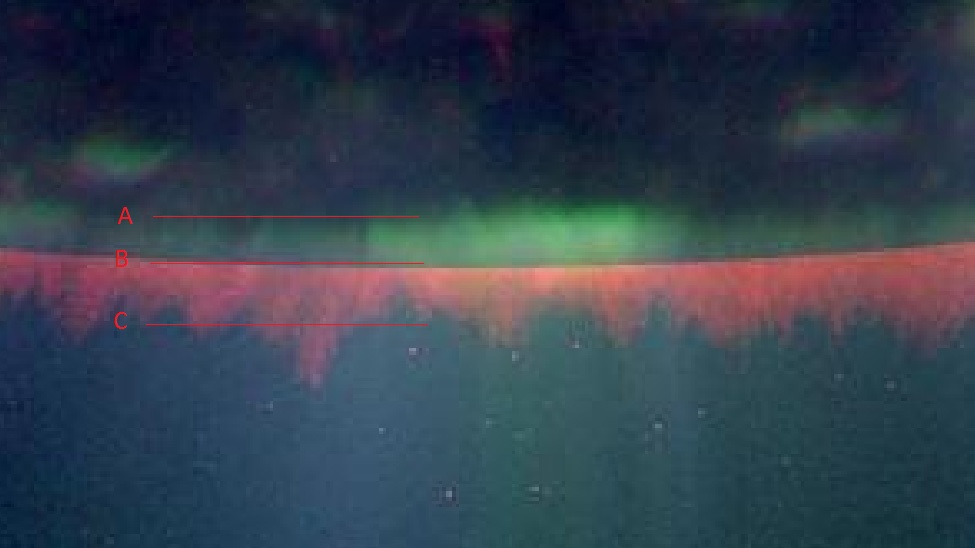
[qimg]http://phunkadelic.org/sd01-2.jpg[/qimg]
Michael, which line points to the boundry between the photosphere and the chromosphere?
What the &$#@? This is hopeless!

The C region is angular due to the mass flow movements inside the loops moving from point A through B) all the way through the chromopshere. That mass flow creates the jagged patterns in the upper chromosphere area marked C).
So, if A and C are ragged due to radial mass flows, why isn't B?