I've been playing with femr's data from WTC7 for a while.
Specifically, I've been looking at the calculations of 1st & 2nd derivatives of the data.
The really interesting part (to me) has been the enormous impact on the calculated velocity & acceleration that results from the simple act of increasing the sampling rate.
People have said before that "computers are the fast way known to generate errors." This may be the purest implementation of that adage that I've ever seen.
I'd like to request that everyone (including me) keep this thread to the engineering. There are plenty of other places that we can express our dissatisfaction with each of our perceptions of the other side's politics, agendas, etc.
Here, let's stick to engineering, please.
Femr, one of the critical questions that we've argued about is your claimed "sub-pixel resolution", as produced by the SynthEyes program.
Here's a simple test.
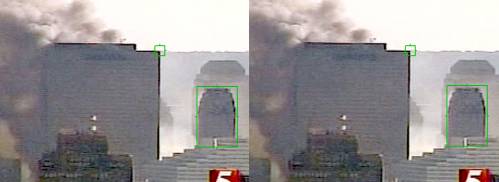
Please pick some points on some other buildings (not WTC7) that have definable points that are comparable (in size, distance, spatial frequency & contrast) to the points on WTC7 that you've tracked, and provide tracings of those feature for several seconds. A couple of tracings of near-to-each-other features (one on WTC7 and one nearby in the frame, but on another building) would be very useful.
Please make sure that all scaling factors are set the same as in your WTC7 traces.
Presumably, that point on that building will be stationary. If there are no "sub-pixel" jumping up & down in those traces, it'll go a long way to showing that the bouncing signal are at least associated with WTC7. Perhaps schlieren effects from heat, if not actual motion of the building.
However, if the signal from a non-impacted building is bouncing just like the WTC7 signal is, then it's pretty clear that source of the trace noise is from some other source. Perhaps the software algorithms.
tom
Specifically, I've been looking at the calculations of 1st & 2nd derivatives of the data.
The really interesting part (to me) has been the enormous impact on the calculated velocity & acceleration that results from the simple act of increasing the sampling rate.
People have said before that "computers are the fast way known to generate errors." This may be the purest implementation of that adage that I've ever seen.
I'd like to request that everyone (including me) keep this thread to the engineering. There are plenty of other places that we can express our dissatisfaction with each of our perceptions of the other side's politics, agendas, etc.
Here, let's stick to engineering, please.
Femr, one of the critical questions that we've argued about is your claimed "sub-pixel resolution", as produced by the SynthEyes program.
Here's a simple test.
Please pick some points on some other buildings (not WTC7) that have definable points that are comparable (in size, distance, spatial frequency & contrast) to the points on WTC7 that you've tracked, and provide tracings of those feature for several seconds. A couple of tracings of near-to-each-other features (one on WTC7 and one nearby in the frame, but on another building) would be very useful.
Please make sure that all scaling factors are set the same as in your WTC7 traces.
Presumably, that point on that building will be stationary. If there are no "sub-pixel" jumping up & down in those traces, it'll go a long way to showing that the bouncing signal are at least associated with WTC7. Perhaps schlieren effects from heat, if not actual motion of the building.
However, if the signal from a non-impacted building is bouncing just like the WTC7 signal is, then it's pretty clear that source of the trace noise is from some other source. Perhaps the software algorithms.
tom
Last edited:


")